Custom Dashboard User Guide
Tamaki MES provides a custom dashboard feature that allows users to create personalized dashboards to monitor and visualize important data relevant to their manufacturing processes. A dashboard is made up of widgets, which are individual components that display live data in charts, tables, gauges, and other formats. Widgets can also be buttons or toggles used to control systems directly from the dashboard.
The custom dashboard feature utilizes Ignition's Dashboard component.
Configuring Dashboards
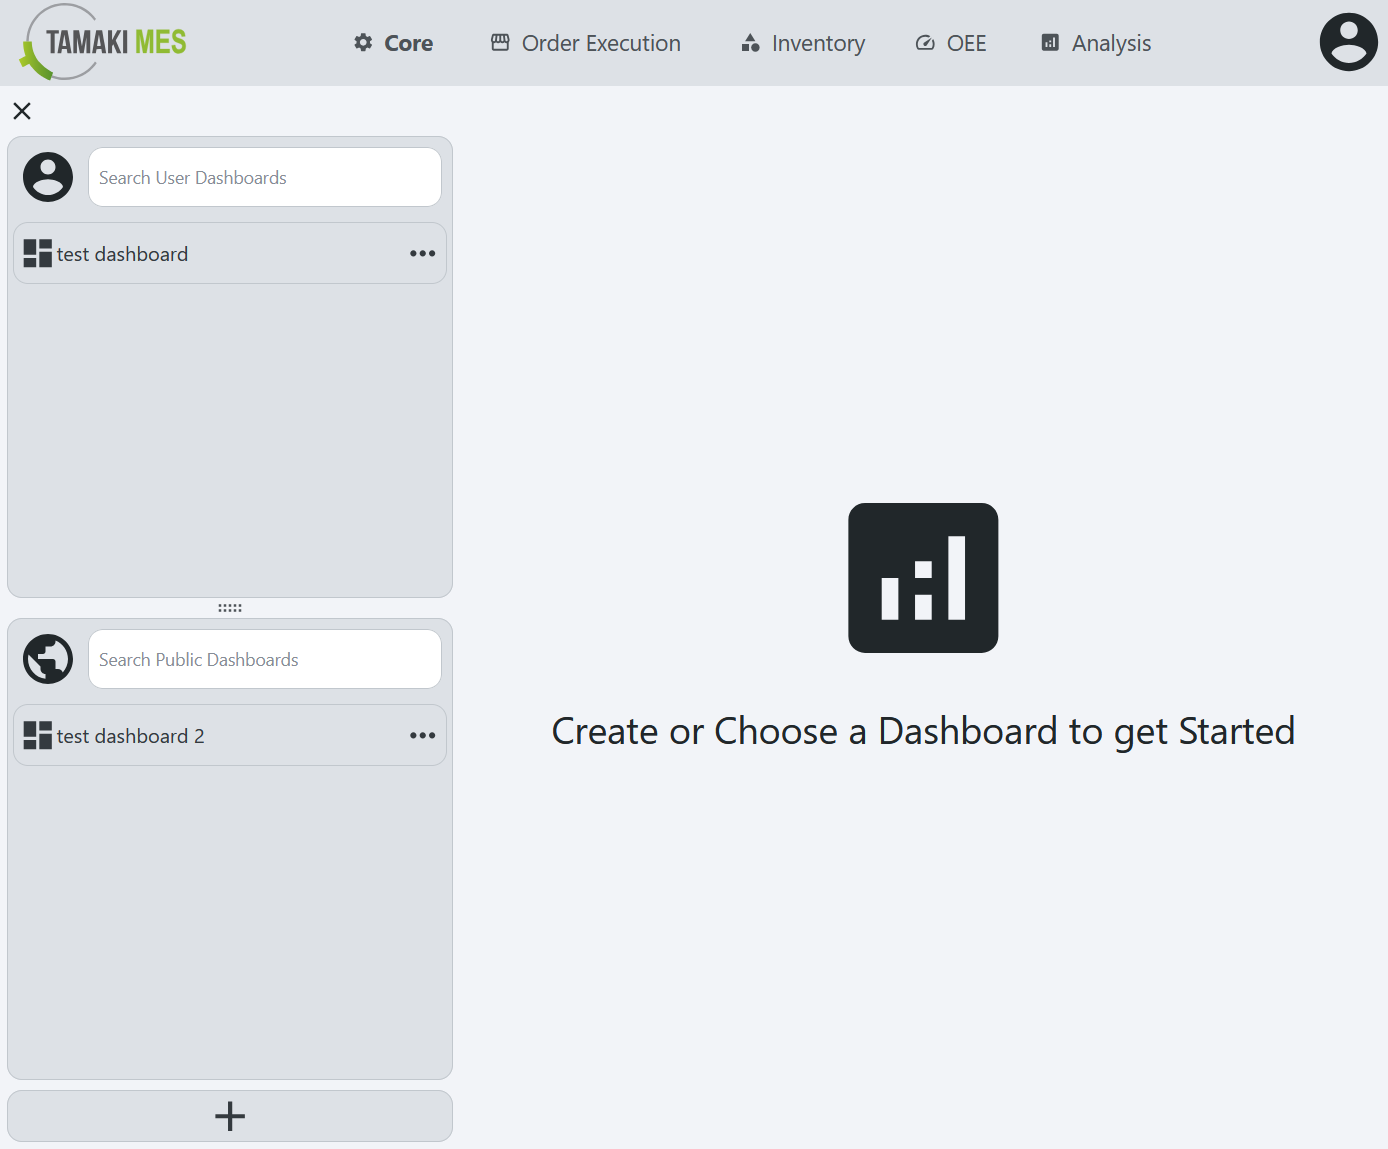
To navigate to the dashboard configuration screen, go to the MES Perspective project and select Core →
Custom Dashboards from the navigation menu at the top of the screen. On the left side of the screen is a sidebar that
contains two lists of dashboards. The top lists dashboards that you have set to be only visible to you, while the bottom
lists dashboards that are visible to all users. To edit or delete a dashboard, find it in one of the lists, select the
icon next to its name, and choose Edit or Delete. To create a new dashboard, click the plus icon located in the
bottom left of the screen.
The dashboard configuration screen has two tabs. The Configuration tab is where general settings for the dashboard are
set, and the Widgets tab is where widgets are added and arranged on the dashboard.
Configuration Tab
This section is for setting the general information about the dashboard. Once the fields are filled out, click the
Confirm button at the bottom of the view.
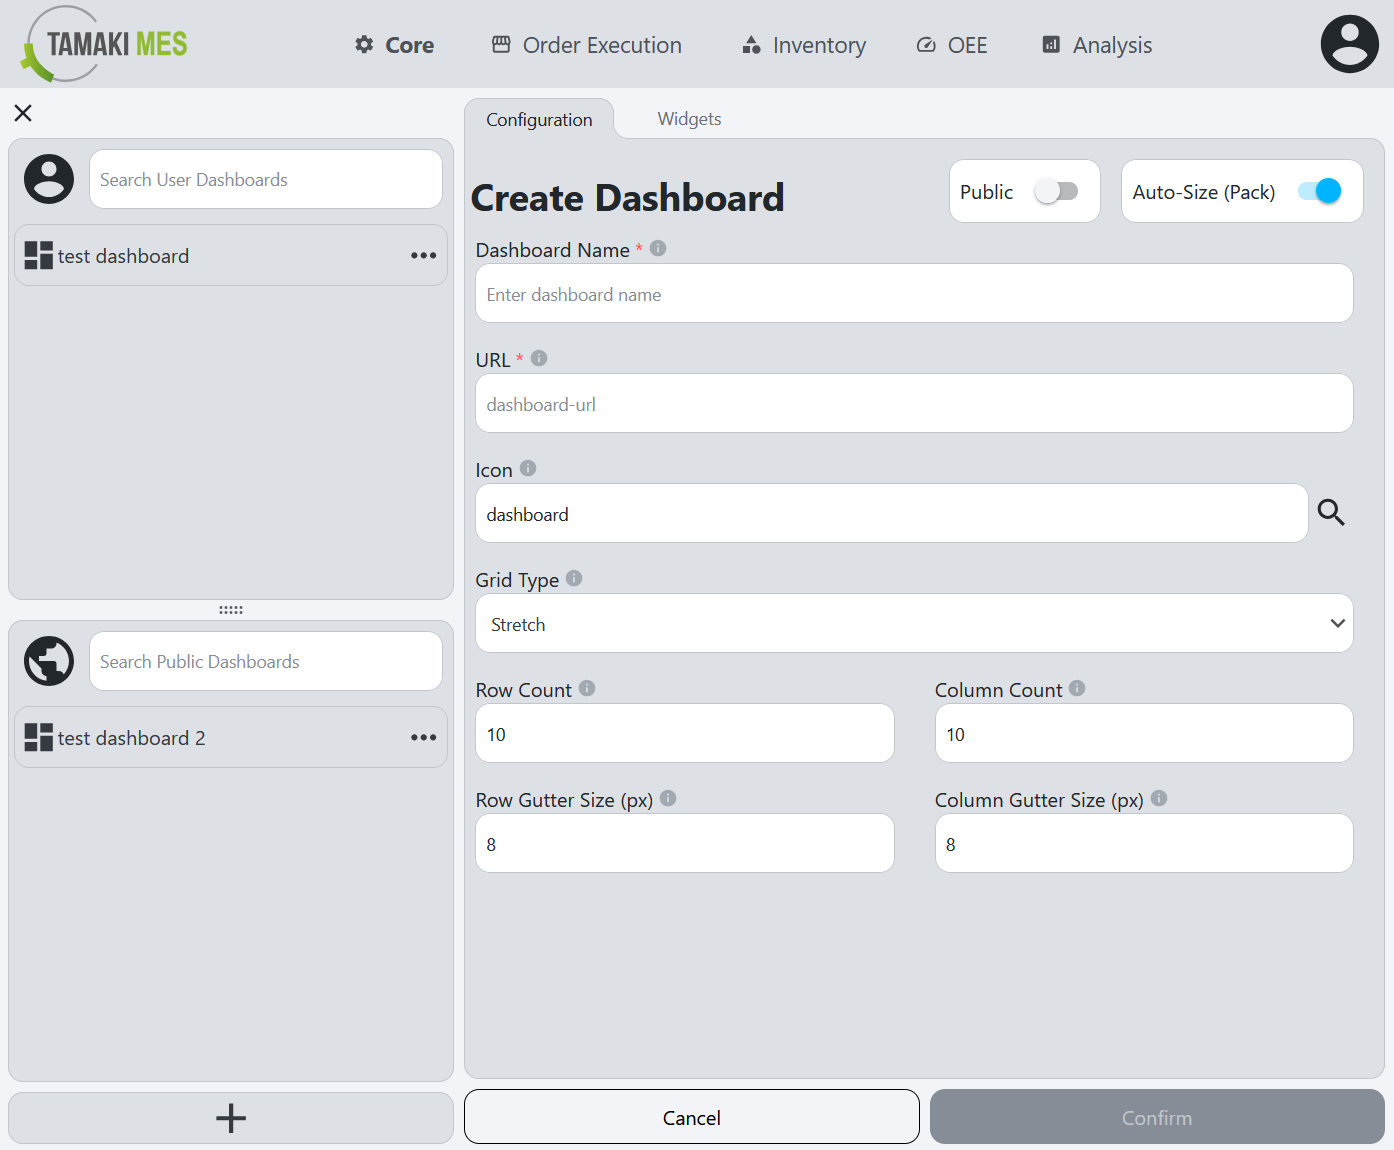
- Name: The name of the dashboard. This is a required field.
- URL: The URL slug for that identifies the dashboard page. This can be used to navigate directly to the dashboard. This is a required field and must be unique
- Icon: The icon that will be displayed for the dashboard in the dashboard list. Click the search icon to open the icon picker dialog.
- Grid Type: Whether the dashboard will grow or shrink to the size of the container.
- Fixed: The dashboard has a fixed size and won't grow or shrink based on the size of its container.
- Stretch: The dashboard will grow or shrink to fill its container.
- Row Count: The number of rows in the dashboard grid.
- Column Count: The number of columns in the dashboard grid.
- Row Gutter Size: The number of pixels between each row in the dashboard grid.
- Column Gutter Size: The number of pixels between each column in the dashboard grid.
- Public: If toggled on, the dashboard will be visible to all users. If toggled off, the dashboard will only be visible to the user who created it.
- Auto-Size: During widget configuration, if this is enabled, widgets will automatically move to fill in any gaps in the dashboard.
Widgets Tab
This section is for adding, arranging, and configuring widgets on the dashboard. Initially the dashboard will be empty,
so the first step is to add widgets. Click one of the empty cells on the grid to open the Add Widget dialog. Select a
widget from the list, such as Numeric Display, and click the Confirm button. The widget will then be added to the
dashboard. When initially added, a widget will often display an error until configured.
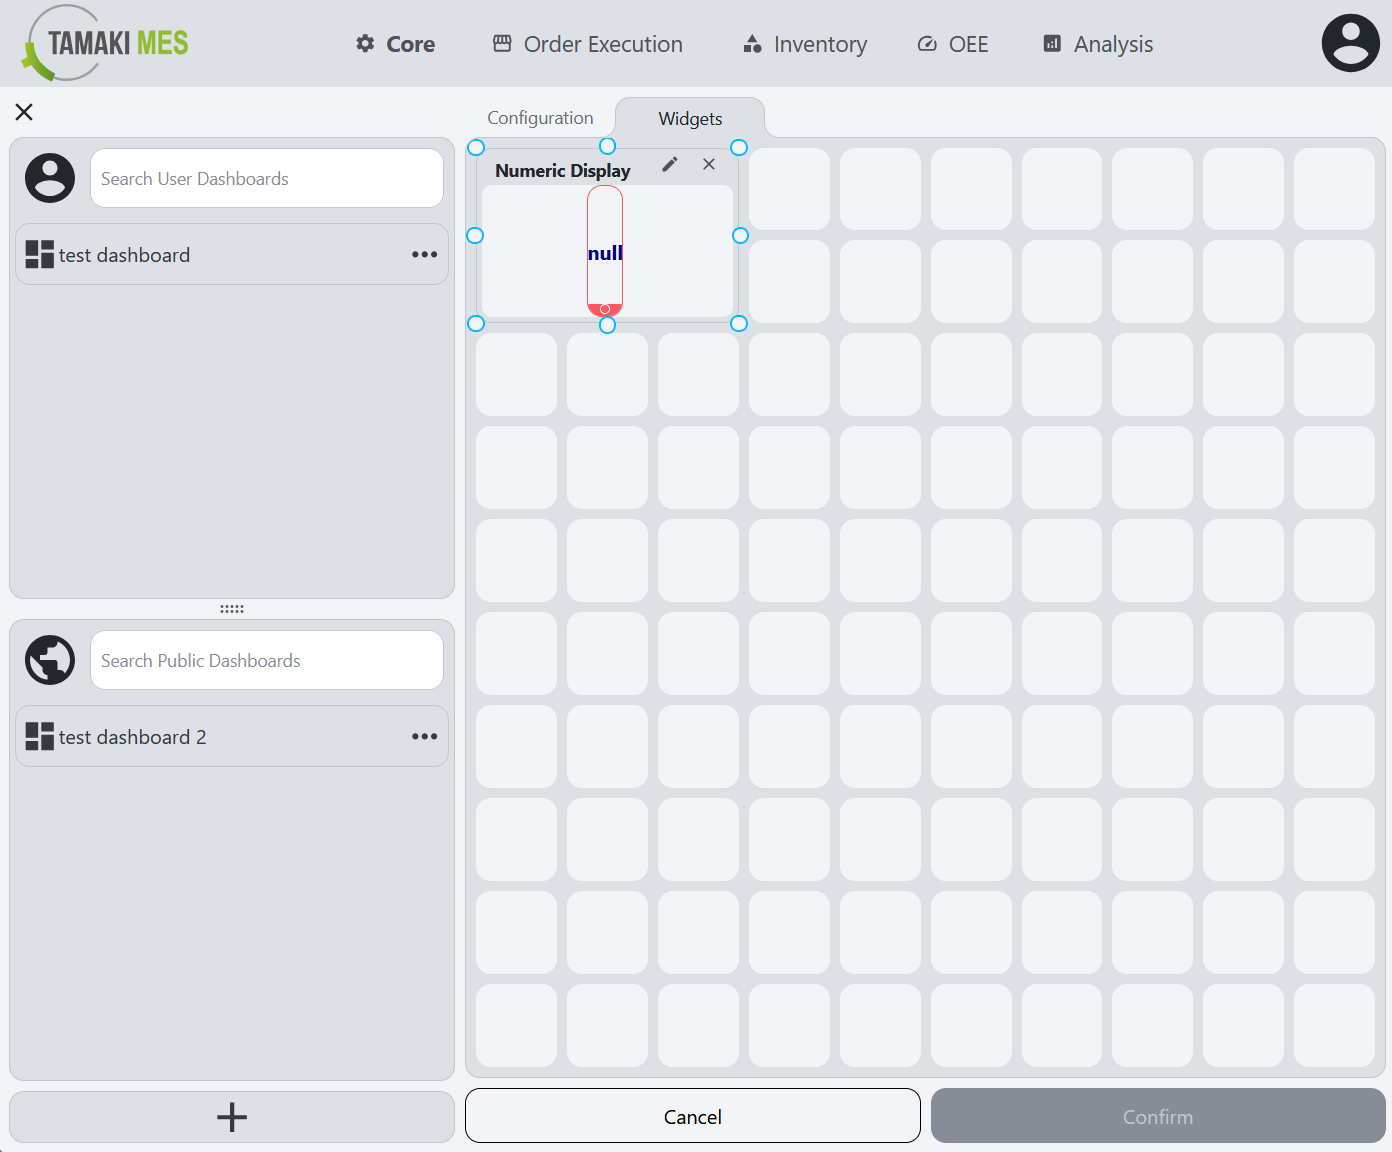
A selected widget can be moved by clicking and dragging it to a new cell and resized by clicking and dragging the
handles on its edge. To remove the widget, click the X icon in the top right corner of the
widget. To configure the widget, click the settings icon in the top right corner of the widget, which will open the
configuration dialog. Once the widget is configured, click the Confirm button at the bottom of the popup.
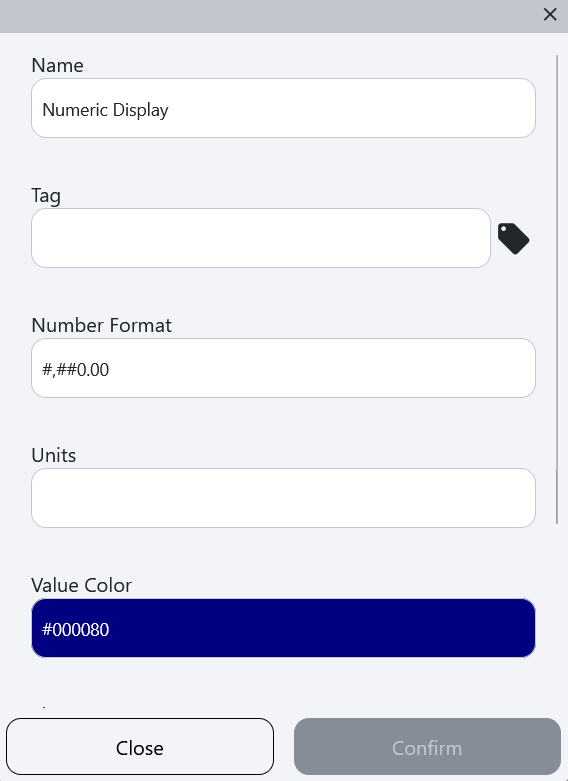
The name is the only consistent field across all widgets. The rest of the fields are parameters that are specific to the widget type. See the Widgets guide for more information on configuring specific widget types.
Viewing Custom Dashboards
To view custom dashboards, navigate to the Dashboard page and select a dashboard from the lists on the left. Alternatively, if you know the URL of the dashboard, you can navigate directly to it by entering it in your browser's address bar. Simply append the dashboard's URL slug to the end of the base URL for your Tamaki MES project.