Time Series Chart Widget
Time Series Chart Widget
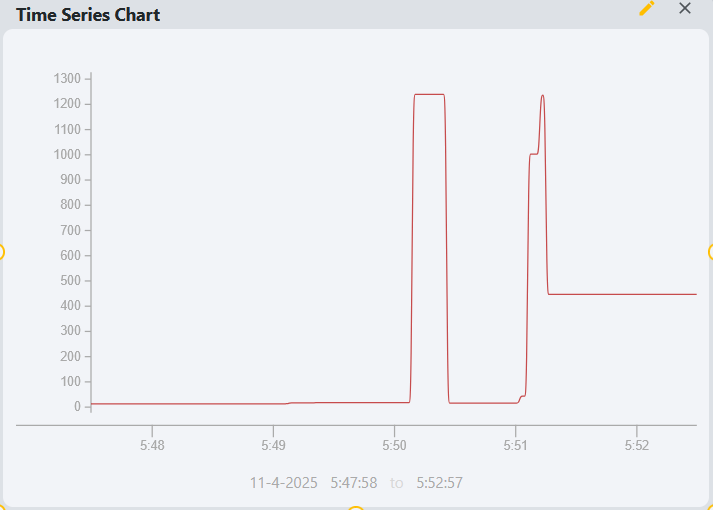
The time series chart widget displays recent historical tag data on a graph. It utilizes the Perspective Time Series Chart component.
Parameters
- Name: The name of the widget instance.
- Title: The title displayed at the top of the chart.
- Tag: The path of the tag to be displayed on the chart. This should be a numeric tag with historization enabled. Clicking the tag icon will open a tag browser to select the desired tag.
- Chart Type: The type of chart to display. Options include Line, Area, Bar, and Scatter.
- Range: How many minutes of historical data are shown on the chart. A time range of 5 minutes will show data from the last 5 minutes, for example.
- Poll: Toggle to enable or disable automatic polling for new data.
- Poll Rate: The frequency in seconds at which the chart updates with new data.
- Y-Axis Auto Range: Toggle to enable or disable automatic scaling of the Y-axis based on the data range.
- Pen Color: The color of the line or area representing the tag data on the chart.