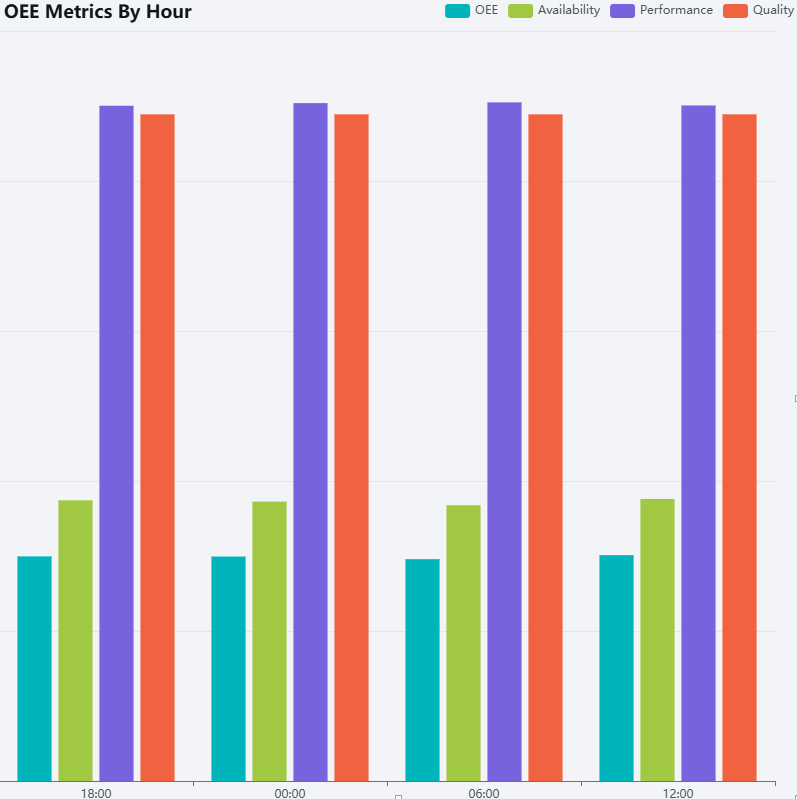
OEE By Time Interval Widget
The OEE by time widget displays a bar graph of the recent Overall Equipment Effectiveness (OEE) for a specified location averaged over specified time intervals.
Parameters
- Name: The name of the widget instance.
- Location: The location to display OEE data for.
- Duration: The total range of time shown on the chart. A duration of 6 hours will show OEE data from the last 6 hours, for example.
- Refresh Interval: How often the widget refreshes its data.
- Time Interval: The size of the time buckets to average OEE over. A time interval of 1 hour will show the average OEE for each hour in the specified duration.
- Time Interval Units: The units for the time interval. Options include Seconds, Minutes, Hours, and Days.