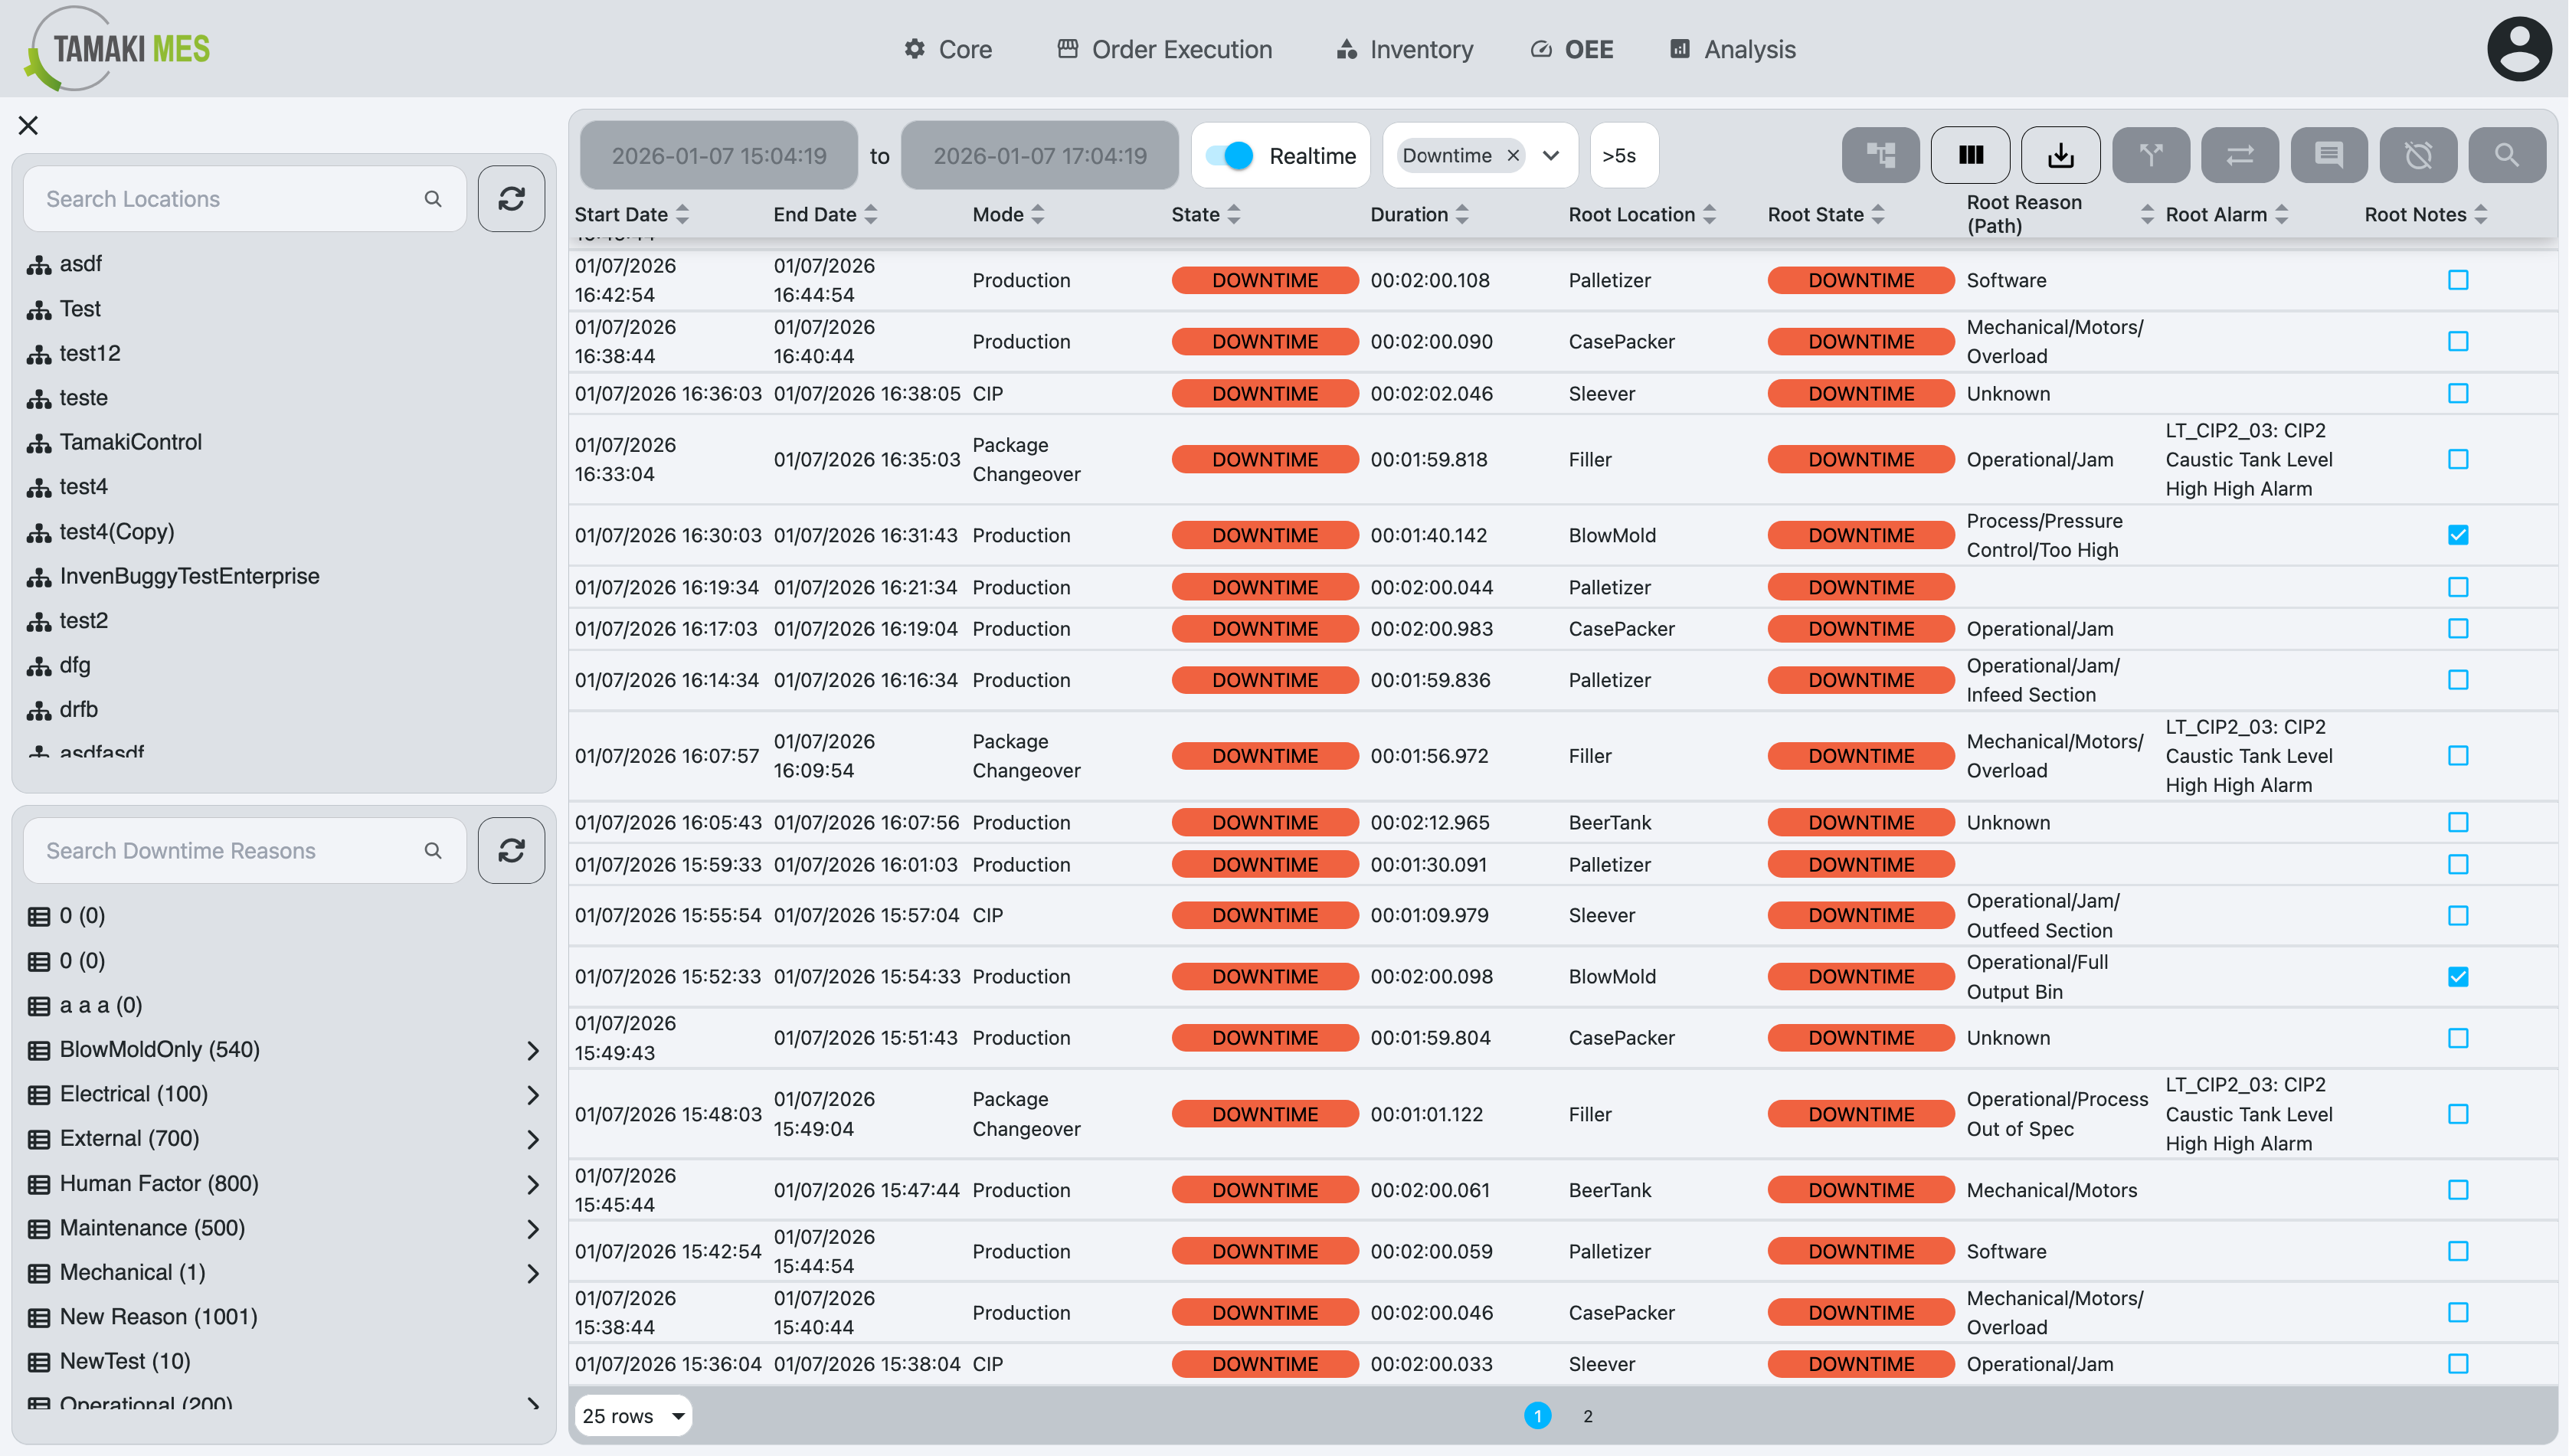
Downtime Entry
Navigation:

Example:
Description:
- The Downtime Entry screen allows users to acknowledge downtime events and enter details about the downtime, such as the reason for the downtime, the start and end times, and any additional notes. This information is crucial for analyzing downtime trends and improving OEE.
Components:
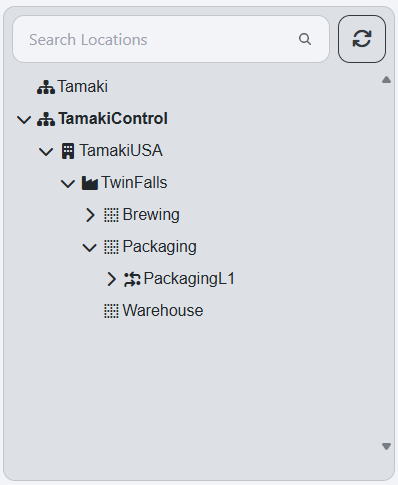
Location Tree
Example:
Description:
- The Location Tree displays the hierarchy of locations within the production line. Users can select a specific location to view and manage downtime events associated with that location. The tree structure allows for easy navigation through different levels of the production line.
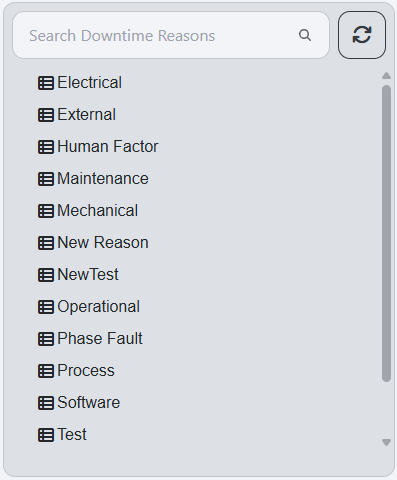
Downtime Reason Tree
Example:
Description:
- The Downtime Reason Tree displays the available downtime reasons that can be selected when entering a downtime event. Users can select a reason to view and manage downtime events associated with that reason. The tree structure allows for easy navigation through different categories of downtime reasons.
Downtime Event Table
Example:
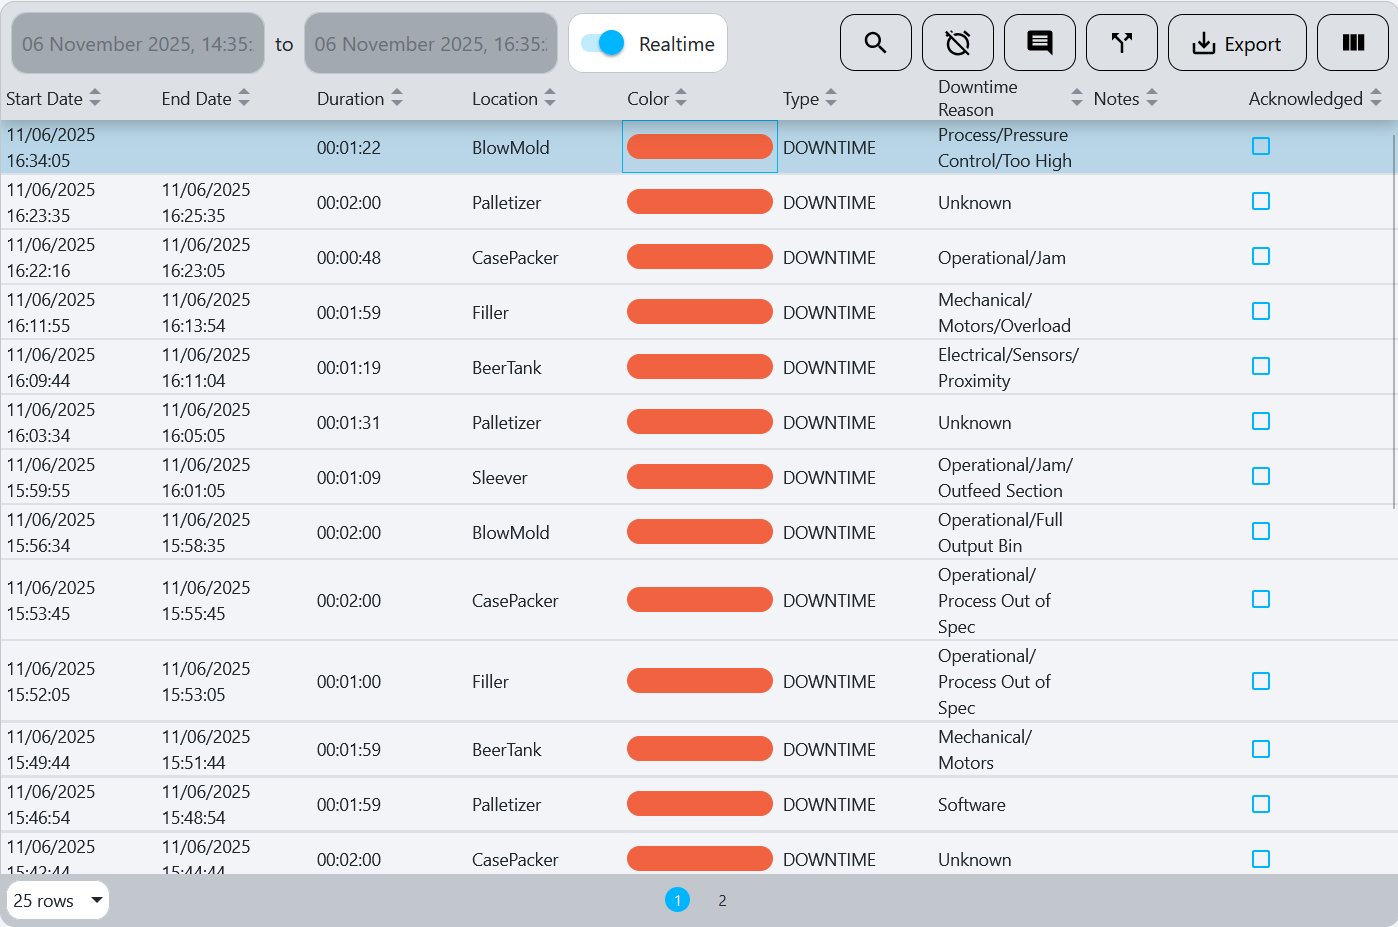
Description:
- The Downtime Event Table displays a list of downtime events that have been entered for the selected location and availability reason. Each row in the table represents a specific downtime event.
Components
Table Columns
| Column | Description |
|---|---|
| Start Date | Start date of the downtime event. |
| End Date | End date of the downtime event. |
| Duration | Duration of the downtime event. |
| State | State of the Location during the downtime event. |
| Location | Location that the downtime event is occuring for. |
| Color | Color of the state of the downtime event. |
| Type | Type of the downtime event. |
| Downtime Reason | Downtime reason associated with the downtime event. see OEE Downtime Reason Model |
| Notes | Additional notes or comments about the downtime event. |
| Acknowledged | Boolean of whether the downtime event has been acknowledged. |
Table Buttons
View Event Details
- The
View Event Detailsbutton, , opens the Downtime Event Details popup:
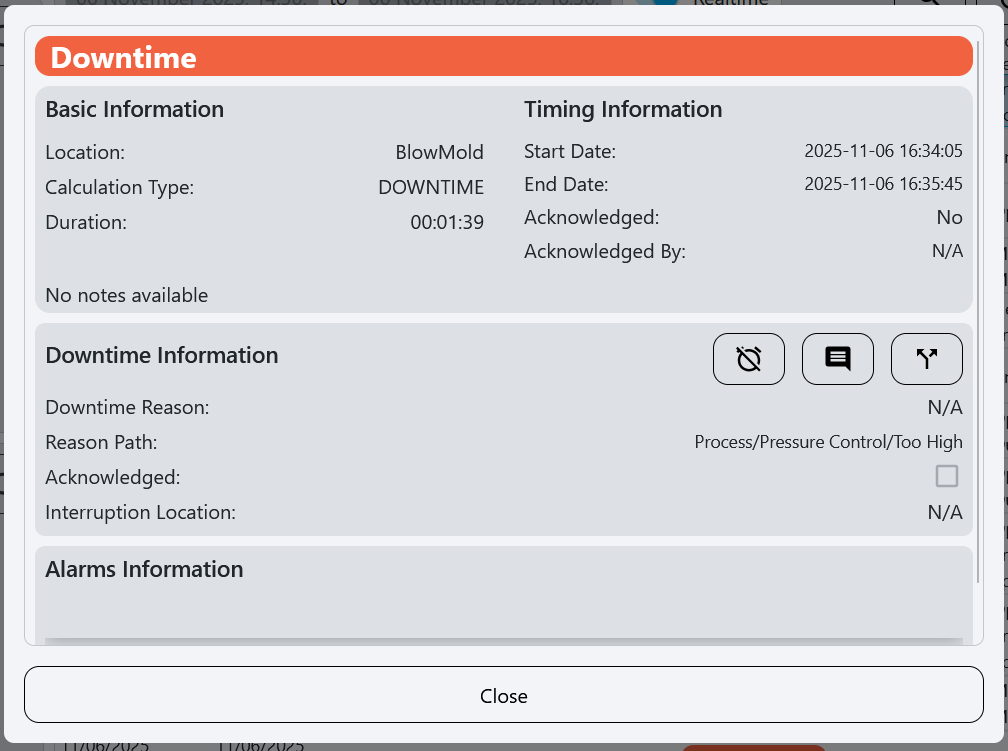
- Sections:
- Top Bar State: displays the current State of the downtime event and its corresponding color.
- Basic and Timing Information: Displays the basic information about the downtime event, including the following:
- Location
- Calculation Type
- Duration
- Start Date
- End Date
- Acknowledged (Yes/No)
- Acknowledged By
- Notes
- Downtime Information: Displays the information about the downtime, including the following:
- Availability Reason
- Reason Path
- Interruption Location
Acknowledge Event
- The
Acknowledge Downtime Eventbutton, , opens the Acknowledge Downtime Event popup:

- Sections:
- Confirm: Click
Confirmto acknowledge the selected downtime event, marking it as reviewed and preventing further edits.
- Confirm: Click
Set Reason Code
- The
Set Downtime Reasonbutton, , opens the downtime reason selection popup:
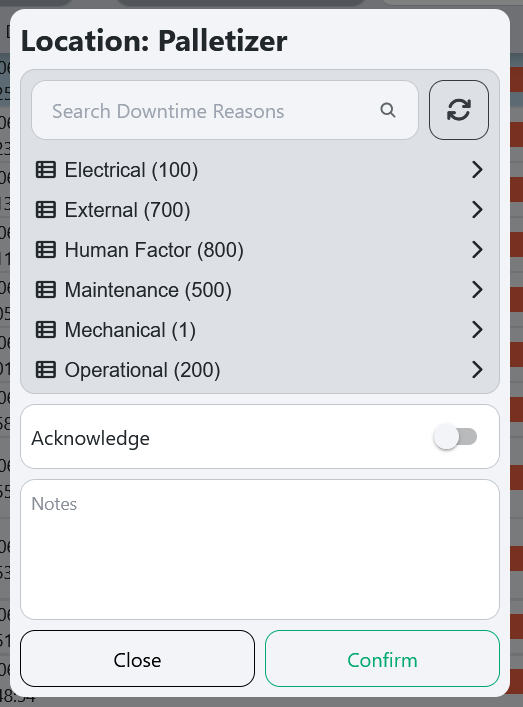
- Sections:
- Downtime Reason Selection Tree: Allows users to select a reason for the downtime event from a hierarchical list of predefined reasons.
- Acknowledge Button: Clicking this button acknowledges the downtime event, marking it as reviewed and preventing further edits.
- Notes Field: A text field for users to add additional notes or comments related to the downtime event.
Split Downtime Event
- The
Split Downtime Eventbutton, , opens the Split Downtime Event popup:
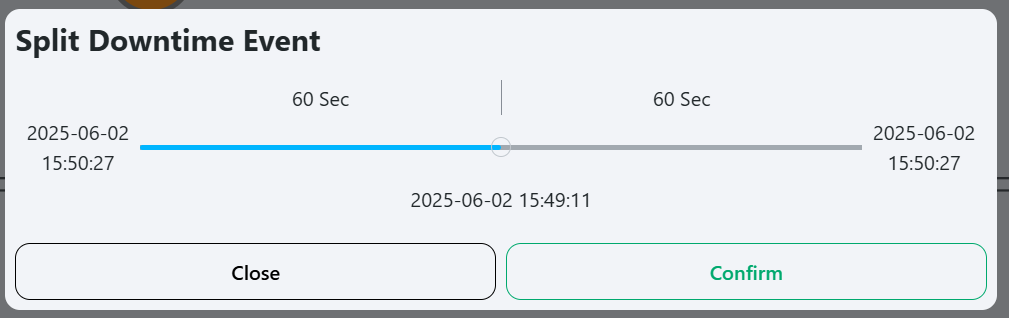
- Sections:
- Slider: Select and drag the middle slider to choose the split point for the downtime event.
- Confirm: Click
Confirmto split the selected downtime event into two separate events at the chosen point.
Export
- The
Exportbutton, , exports all downtime events in the table as a CSV.
Show/Hide Columns
- The
Show/Hide Columnsbutton, , opens the Show Columns popup:
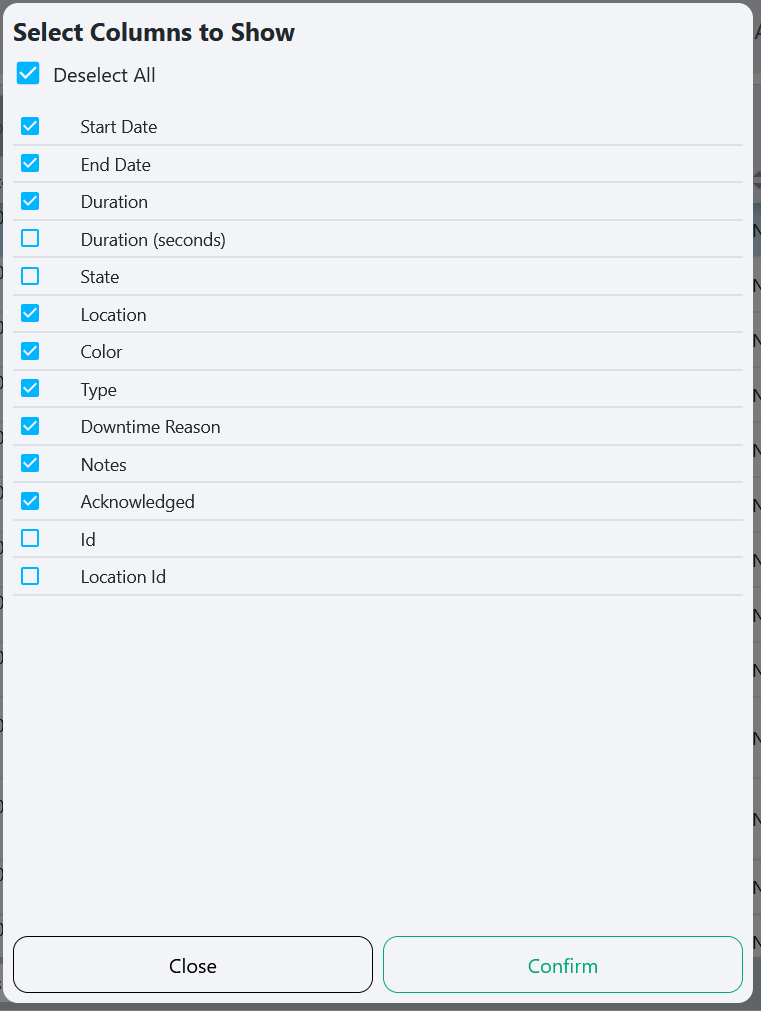
- Sections:
- Deselect All: Quickly unchecks all columns, allowing you to start fresh when customizing your view.
- Column List: Displays all available columns that can be shown or hidden in the downtime events table.
- Confirm: Click
Confirmto apply the selected column visibility settings to the downtime events table.