Downtime Entry
Navigation: OEE → Downtime Entry
Description:
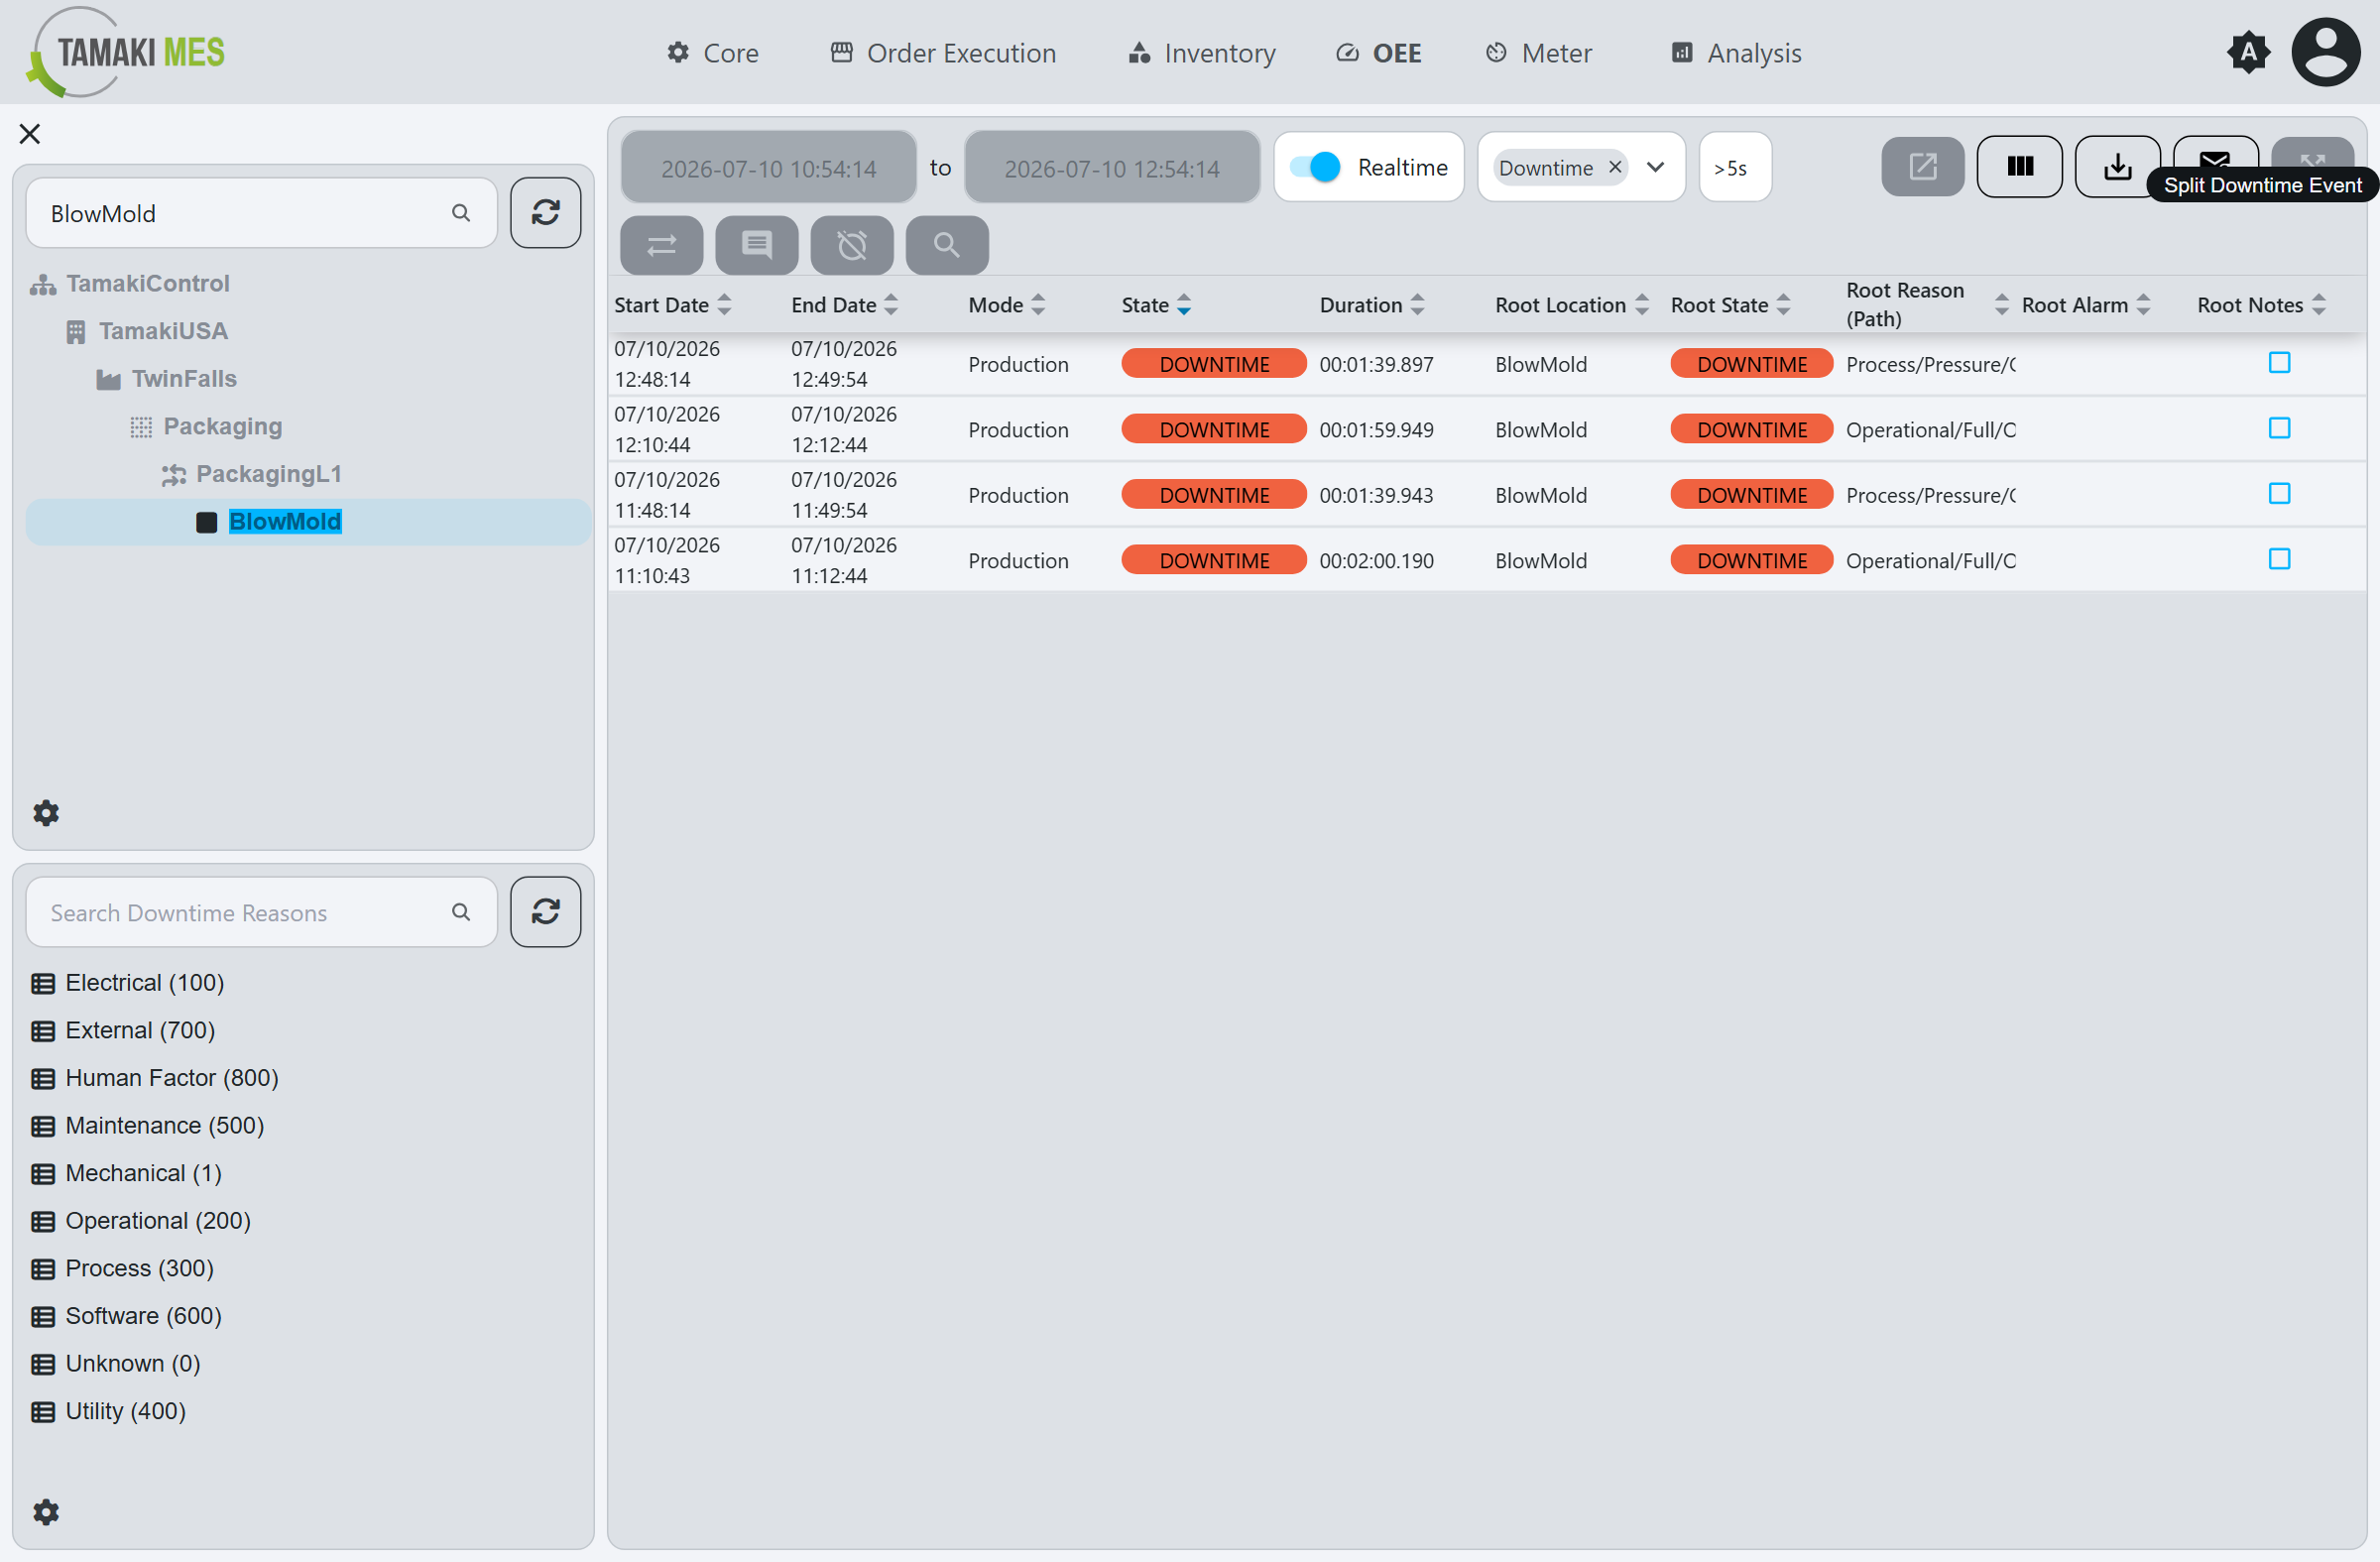
- The Downtime Entry screen lists a location's downtime events and lets operators assign a Downtime Reason, acknowledge events, adjust their root cause and primary alarm, and split an event into two. This information drives downtime analysis and improves OEE.
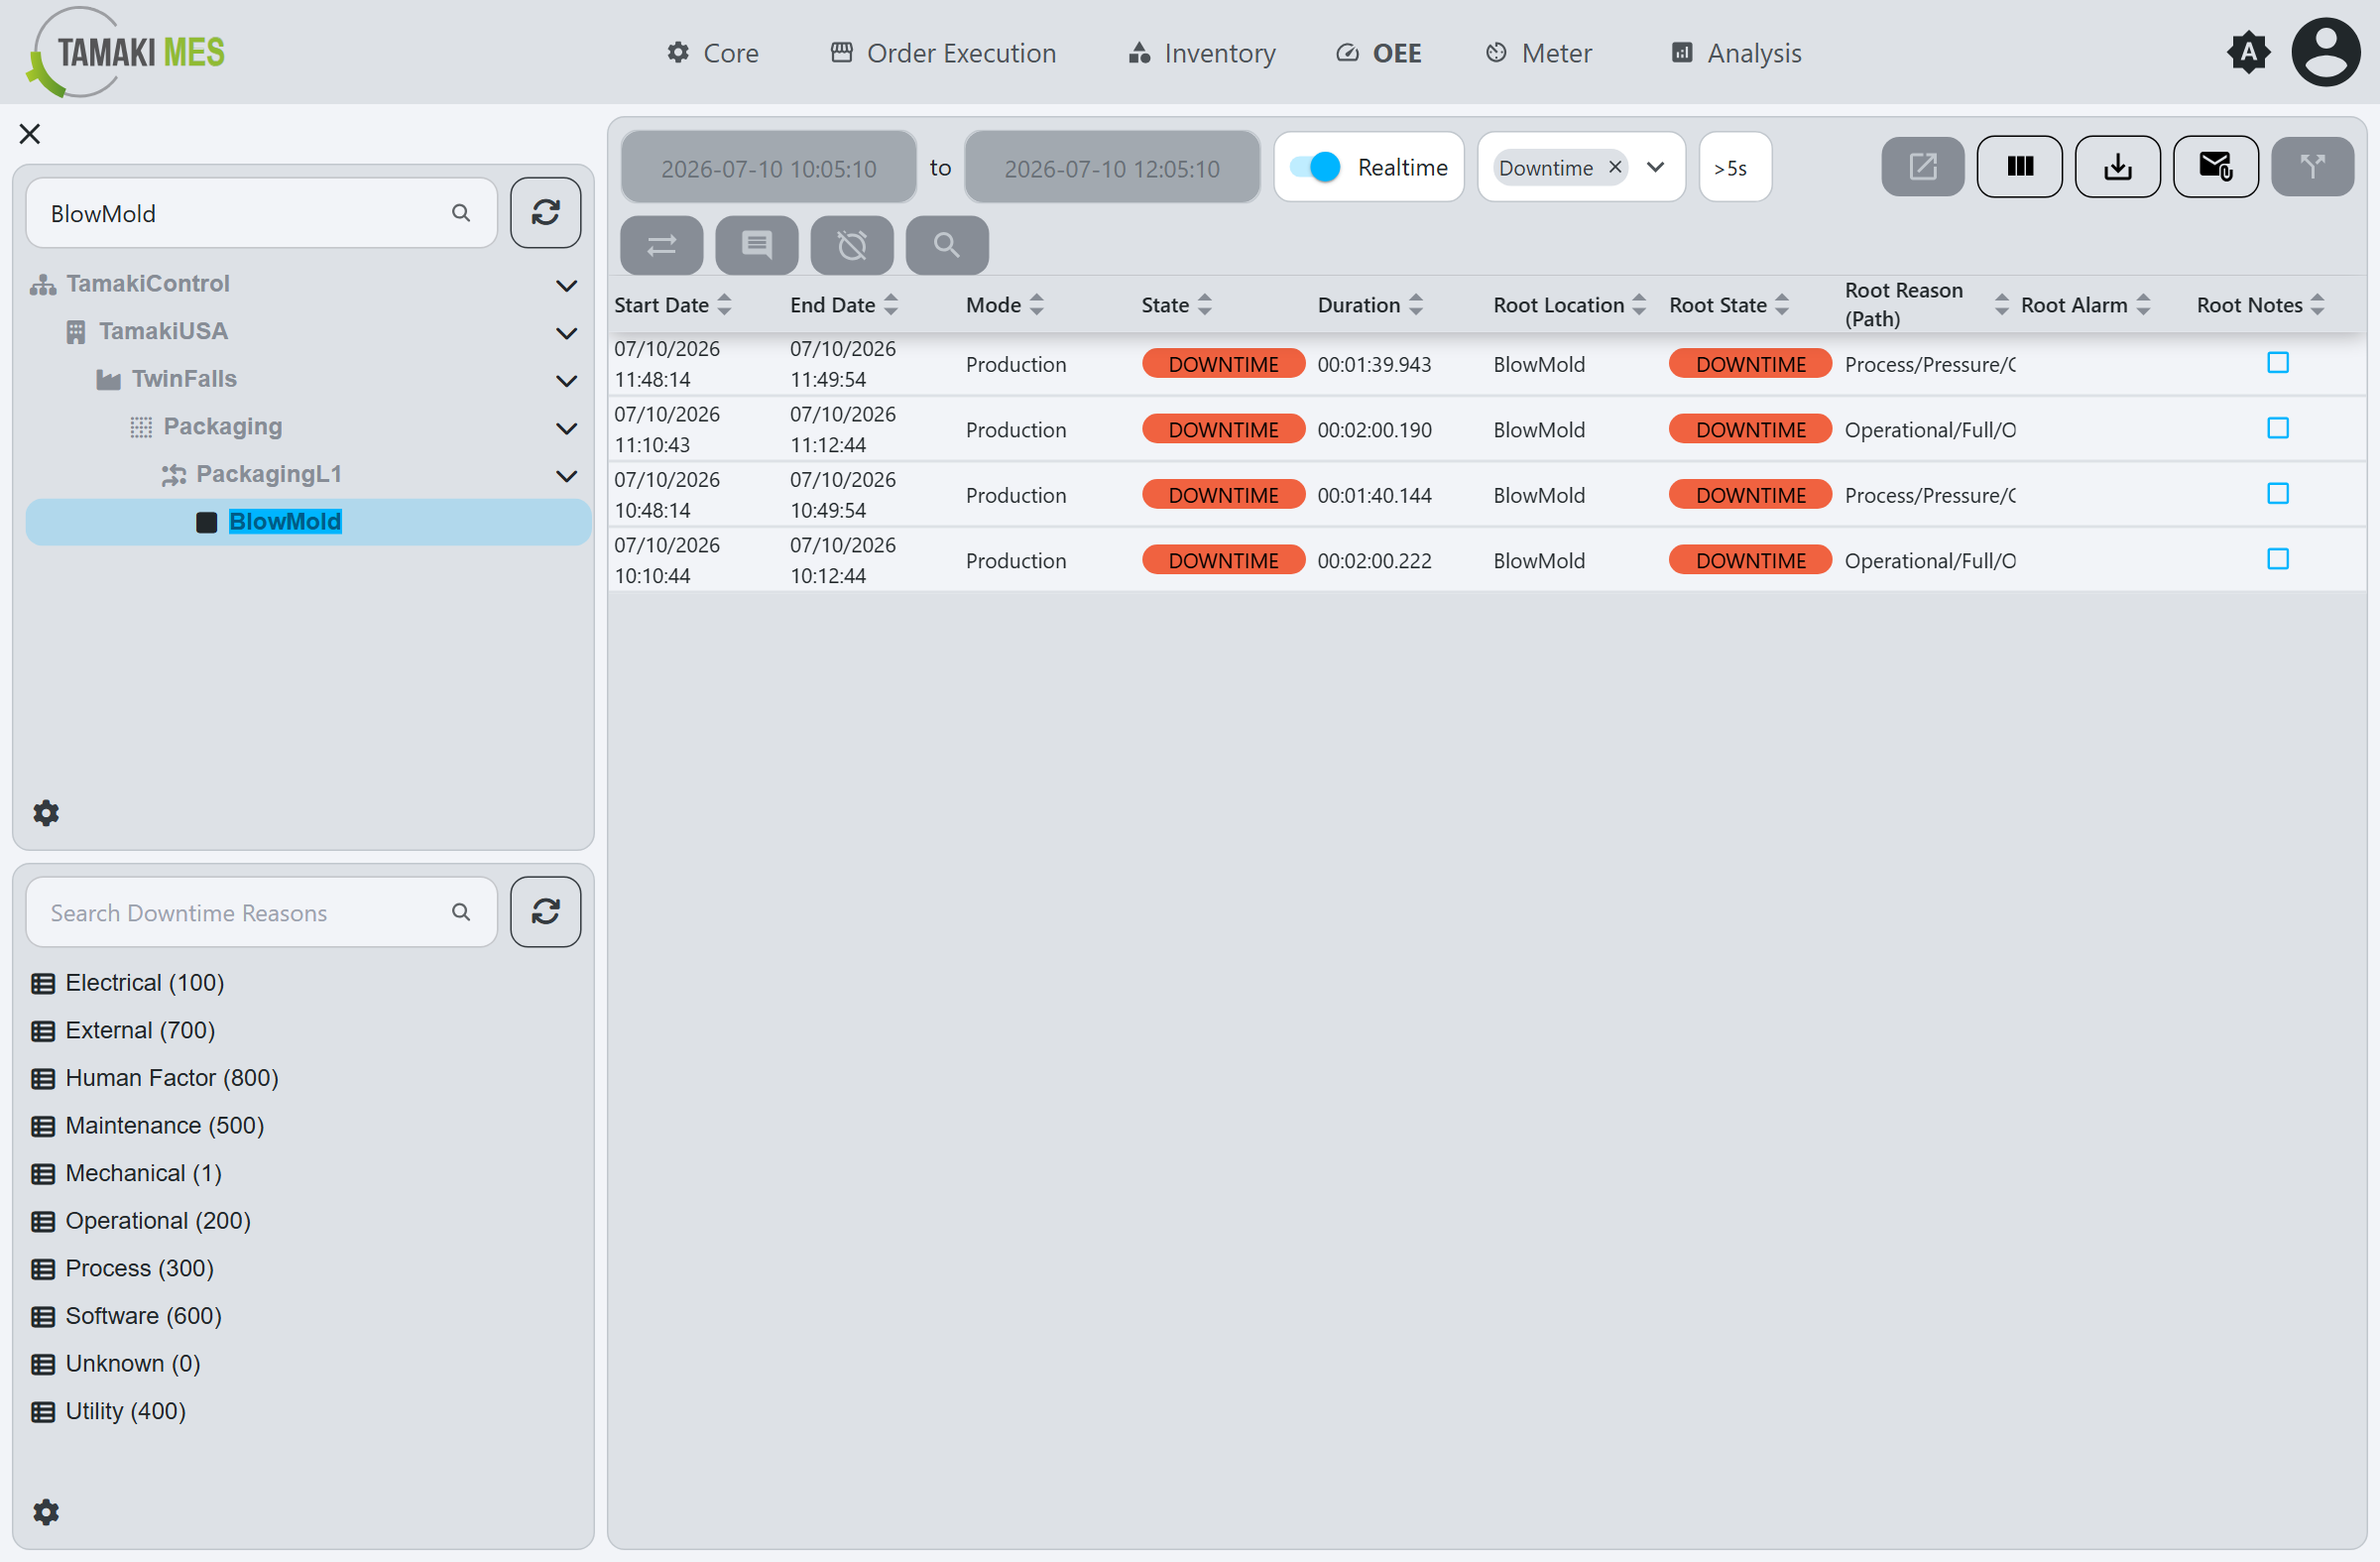
Layout:
- Location Tree (upper left)
- Downtime Reason Tree (lower left)
- Filter Bar (top of the event table)
- Downtime Event Table (right)
Location Tree
The Location Tree shows the hierarchy of locations. Select a location to load its downtime events.
Use the Search Locations box to jump to a location.
Downtime Reason Tree
The Downtime Reason Tree shows the Downtime Reasons available for the
selected location. It is used when assigning a reason to an event. Use the Search Downtime Reasons box
to filter it.
Filter Bar
The bar above the event table controls which events are shown:
- Date range: a start and end date. In Realtime mode the range follows the current time and the table refreshes automatically; toggle Realtime off to pick a fixed historical range.
- State / type filter: limits the table to events of a chosen calculation type (for example
Downtime). - Minimum duration filter: hides events shorter than the chosen duration (for example
>5s), useful for filtering out brief blips.
Downtime Event Table
Each row is a downtime State Record for the selected location.
Table Columns
| Column | Description |
|---|---|
| Start Date | When the event started. |
| End Date | When the event ended. |
| Mode | The Mode the location was in during the event. |
| State | The State of the event, shown with its color. |
| Duration | How long the event lasted. |
| Root Location | The location identified as the root cause of the event (may be an upstream/downstream location for Starved/Blocked states). |
| Root State | The state of the root-cause location. |
| Root Reason (Path) | The full downtime reason path assigned at the root cause. |
| Root Alarm | The primary alarm associated with the root cause, if any. |
| Root Notes | Notes recorded against the root-cause event. |
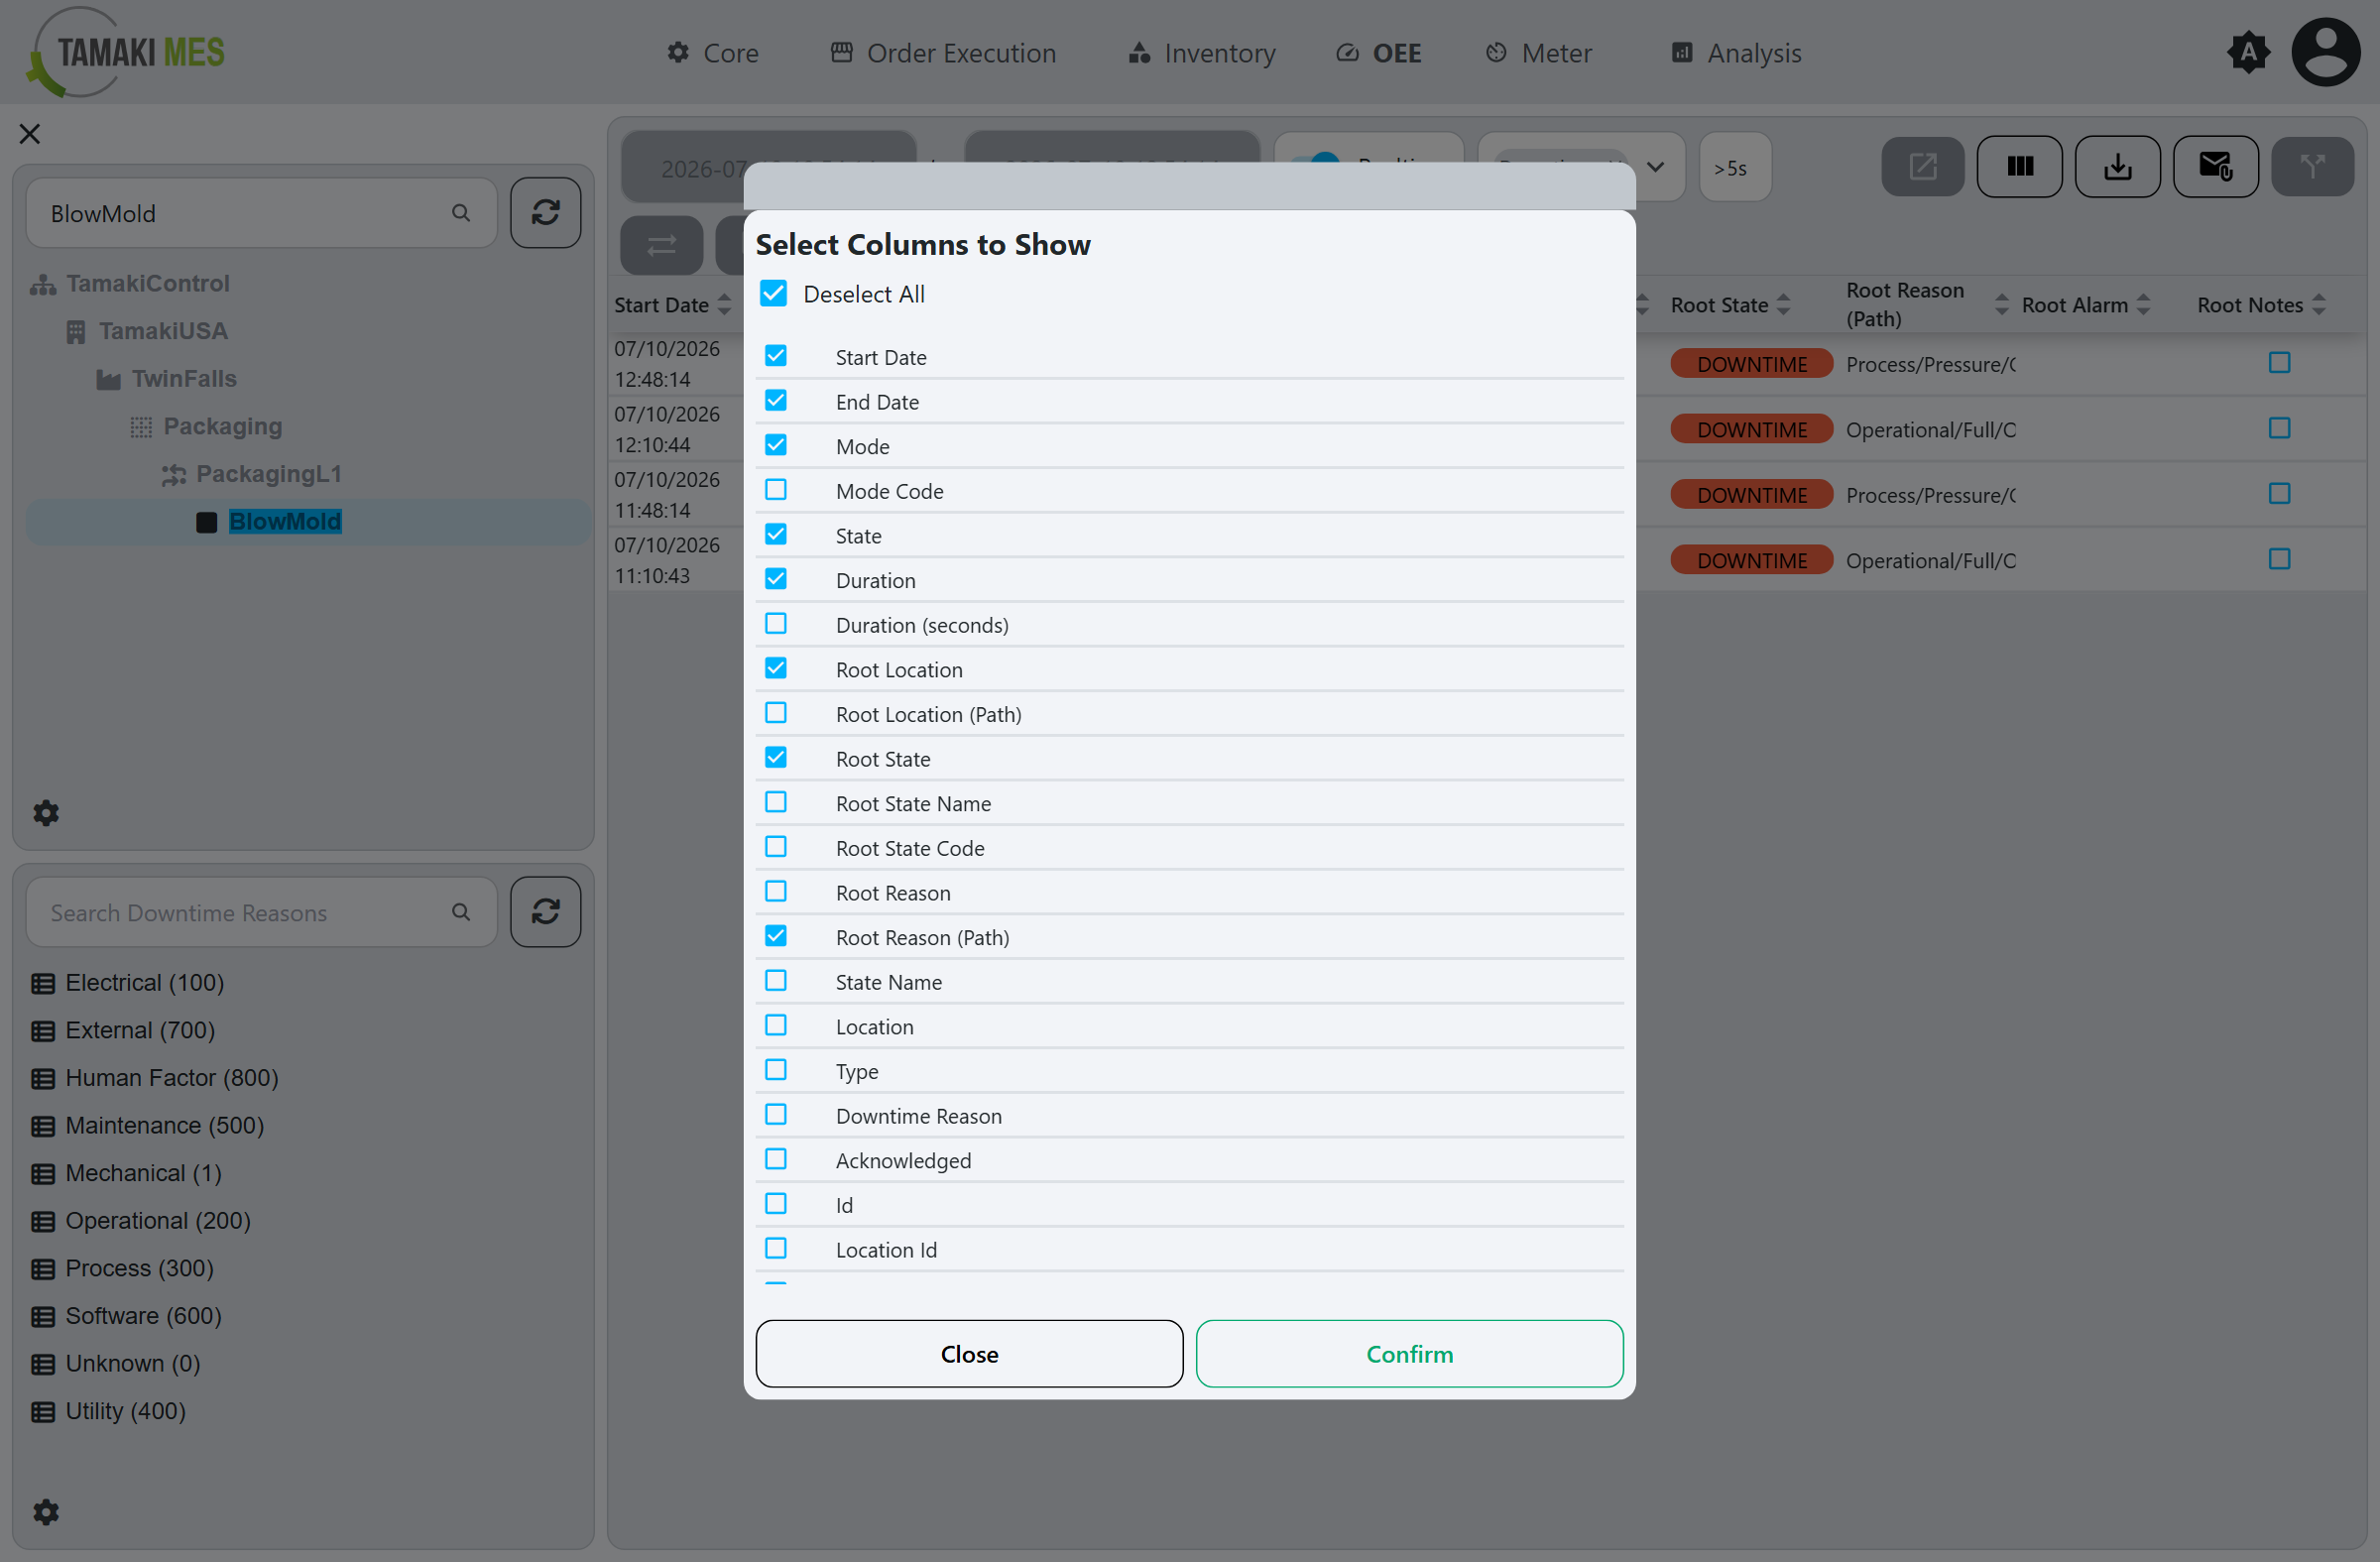
Use Show/Hide Columns to change which columns are visible.
Actions
Select an event, then use the toolbar. Available actions:
Reassign
Changes the recorded State of the selected event.
Set Reason Code
Opens the reason selection popup to assign a Downtime Reason to the selected event.
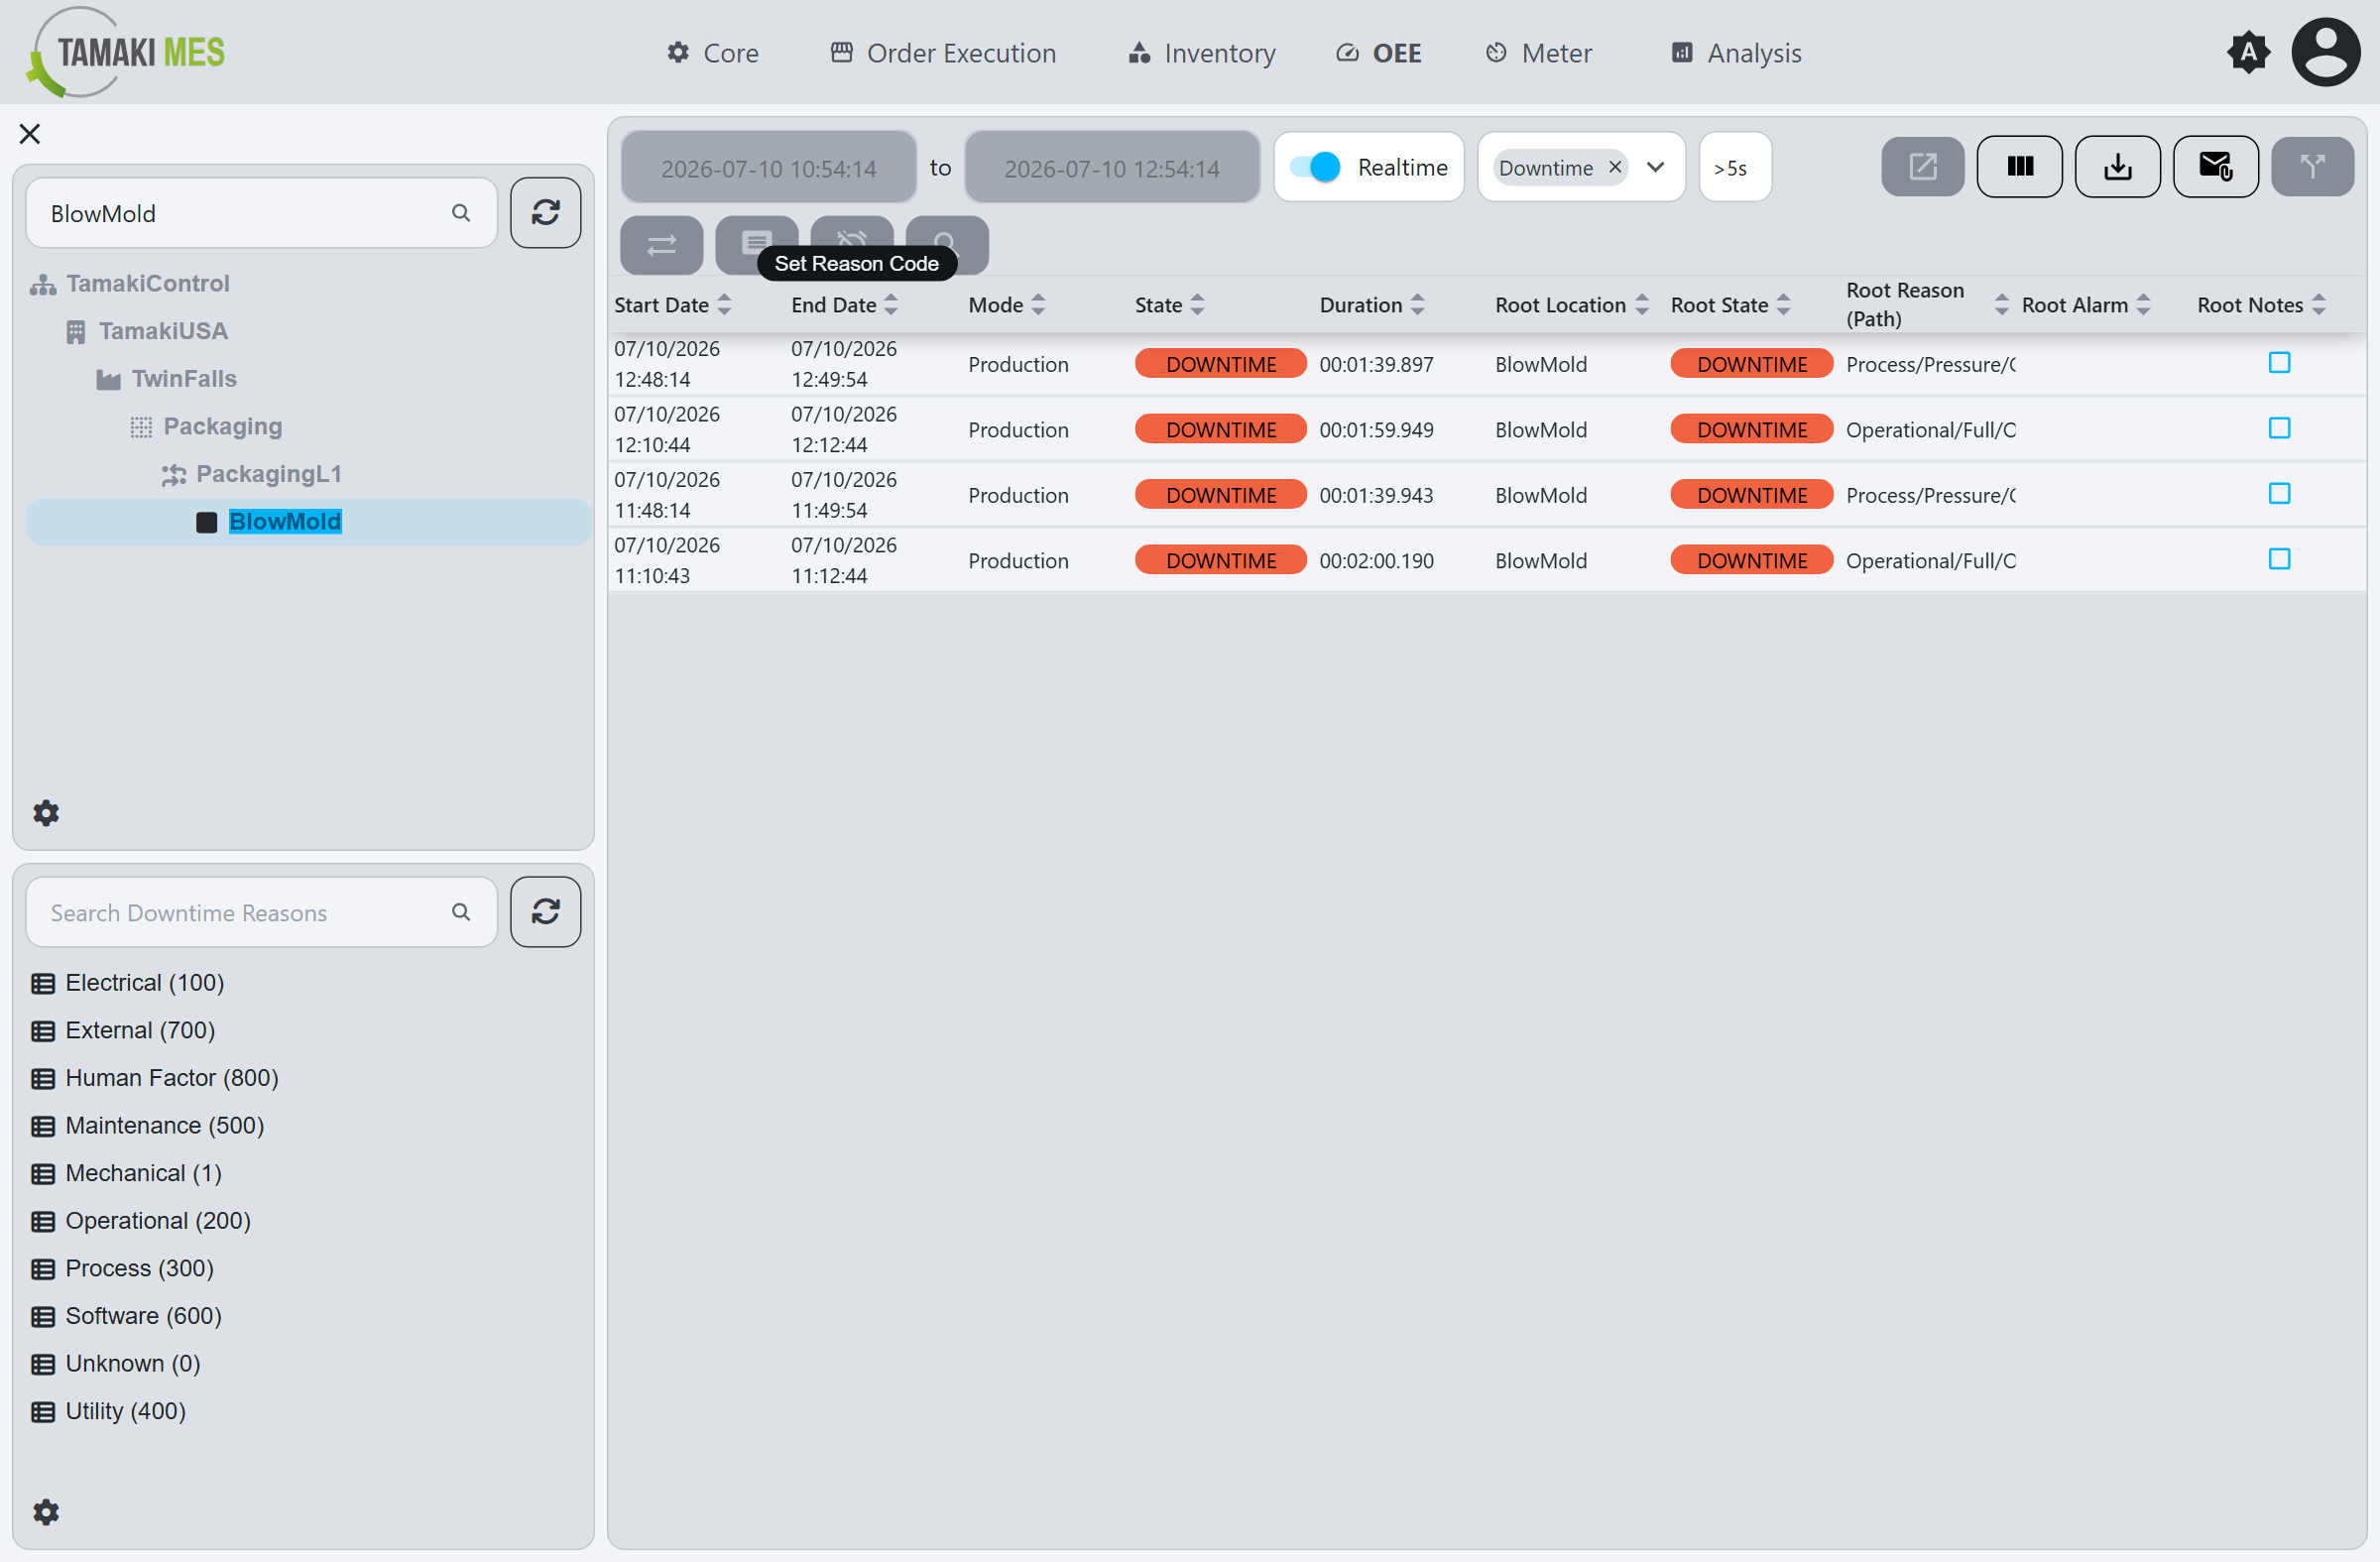
Select a reason from the tree, optionally add notes, and confirm.
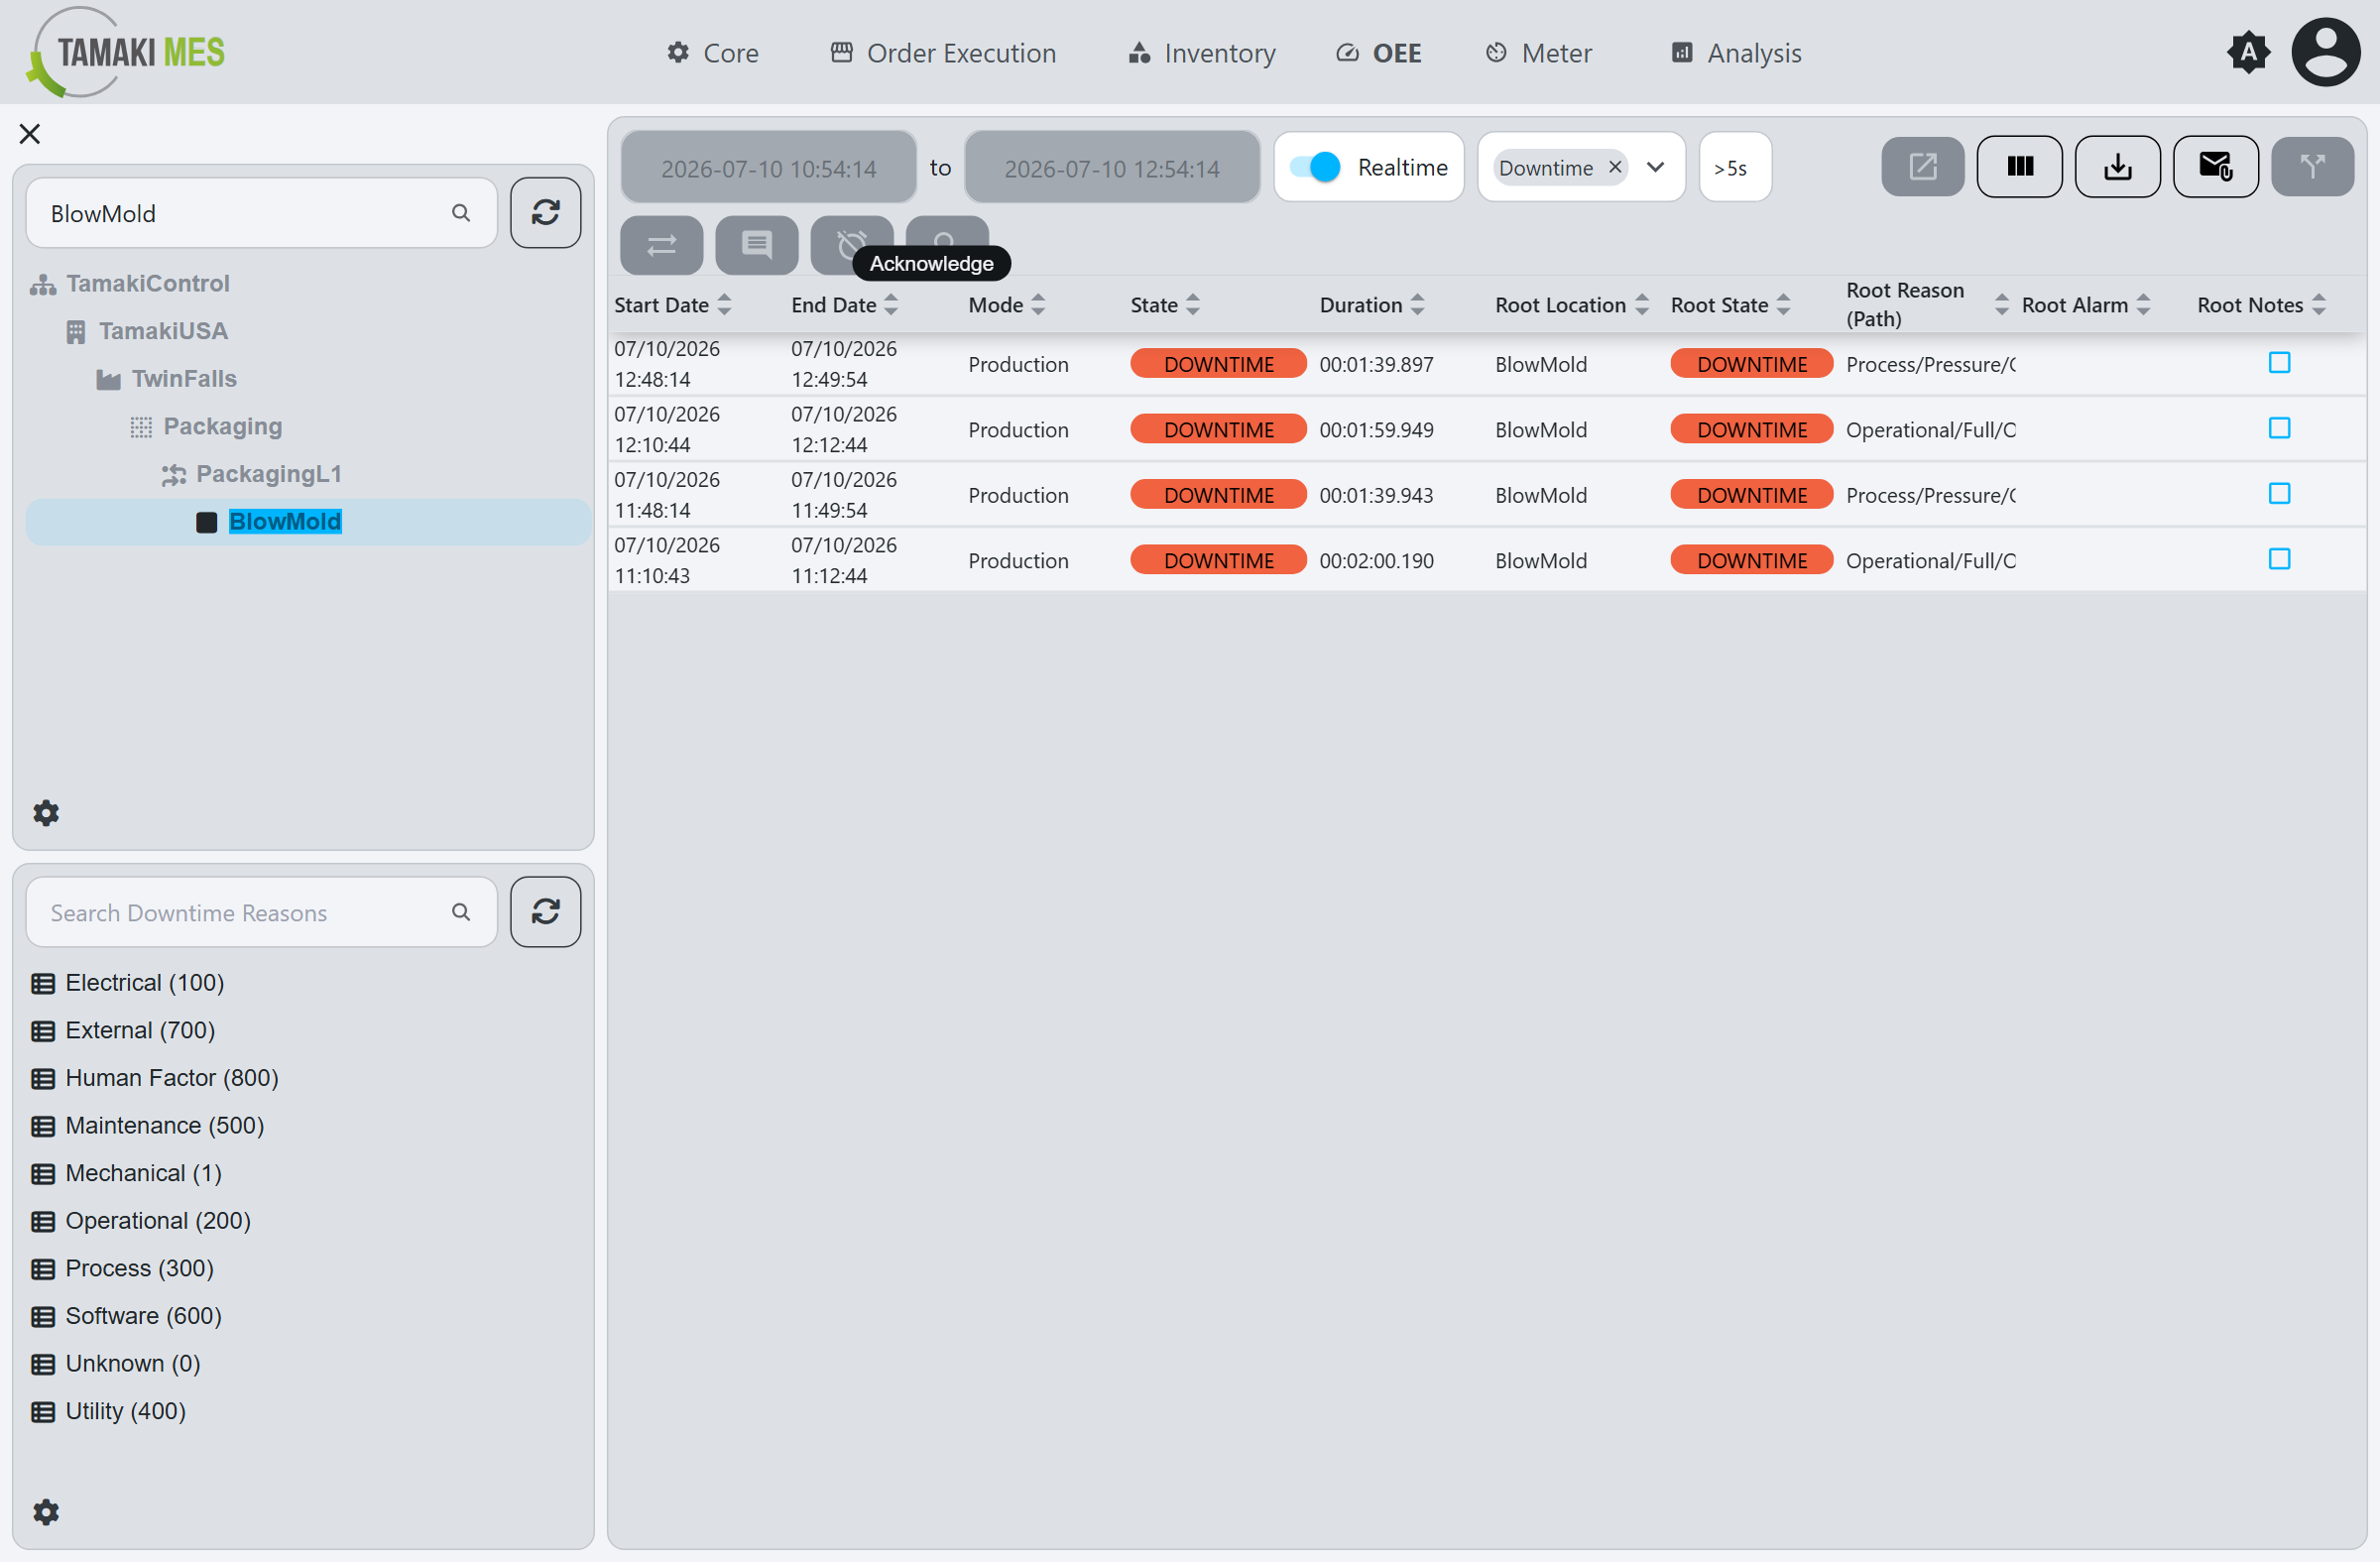
Acknowledge
Opens the acknowledge popup. Acknowledging marks the event as reviewed.
View Event Details
Opens a popup with the full details of the selected event:
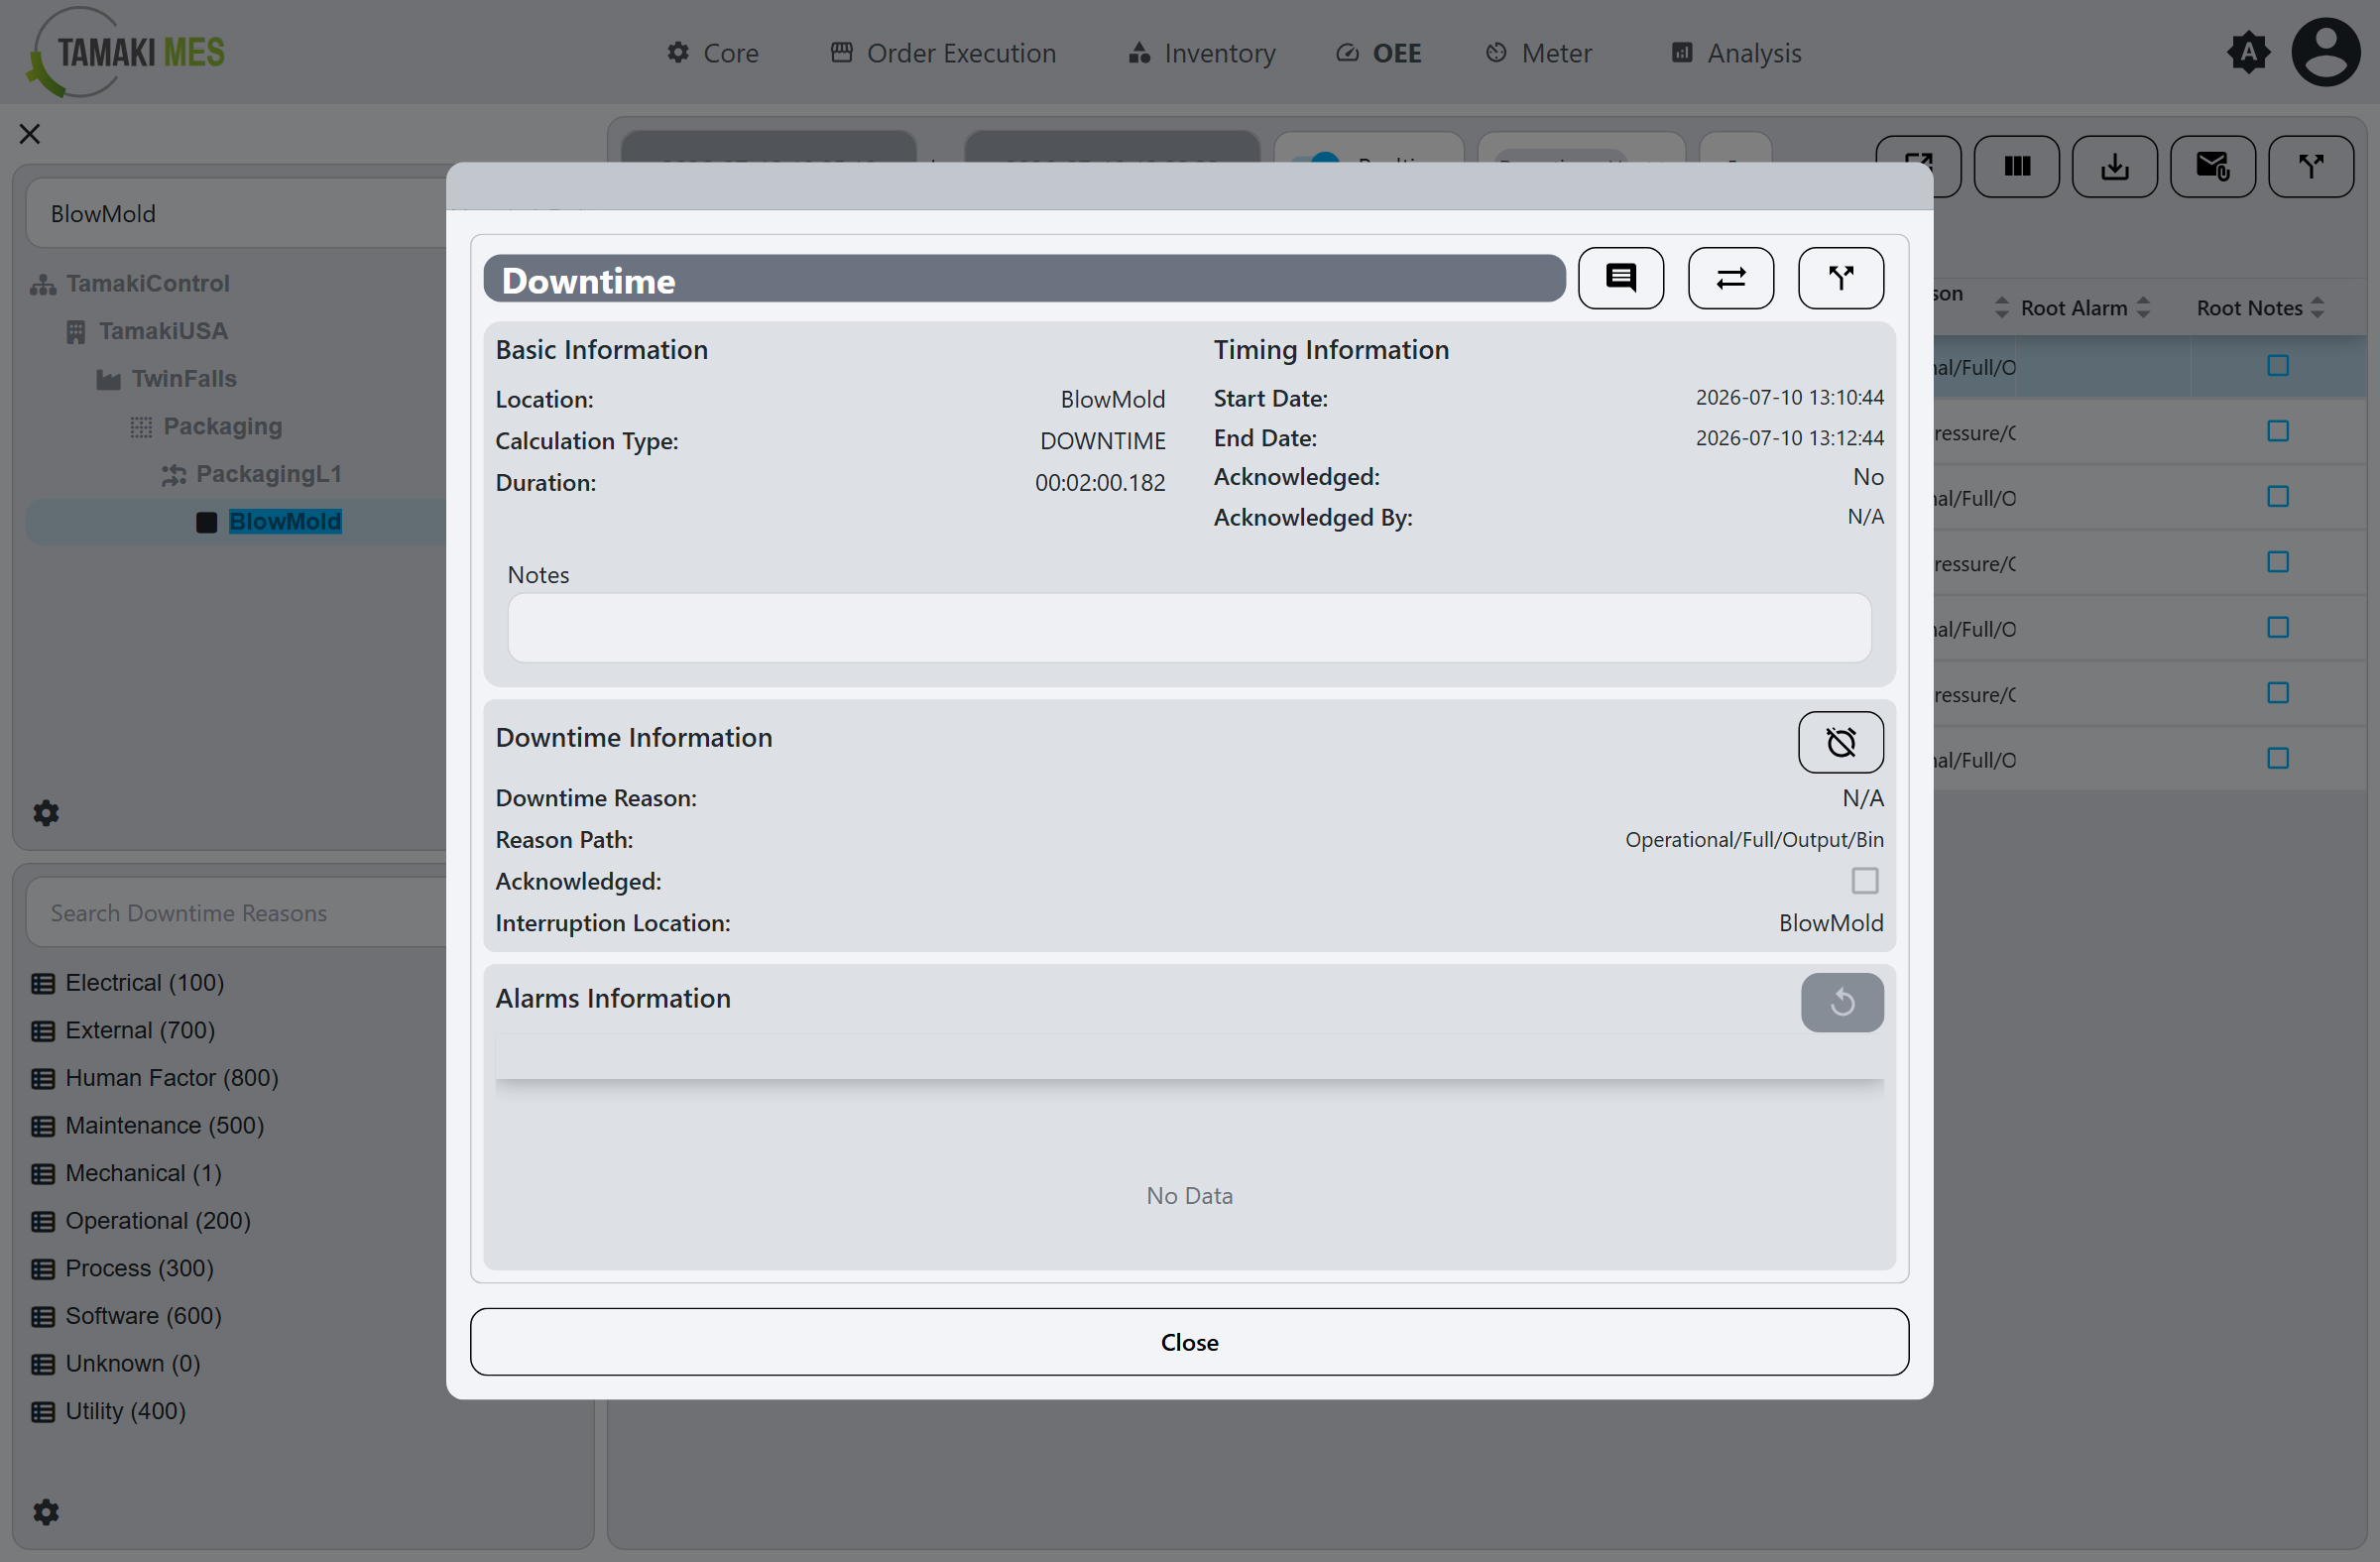
- Basic Information: Location, Calculation Type, Duration.
- Timing Information: Start Date, End Date, Acknowledged, Acknowledged By.
- Notes.
- Downtime Information: Downtime Reason, Reason Path, Acknowledged, and Interruption Location.
- Alarms Information: the OEE Alarms captured during the event. When an event has associated alarms, the one recorded as the event's primary alarm is set from this section.
Split Downtime Event
Opens the split popup. Drag the slider to choose a split point, then confirm to divide the event into two separate events.
Go to Root Cause
Navigates from the selected event to the state record at its root-cause location.
Show/Hide Columns
Opens a checklist of the table's columns so you can toggle each on or off.
Export
Exports the events currently shown in the table to a CSV file.