Unit Dashboard
Navigation: OEE → Unit Dashboard
Description:
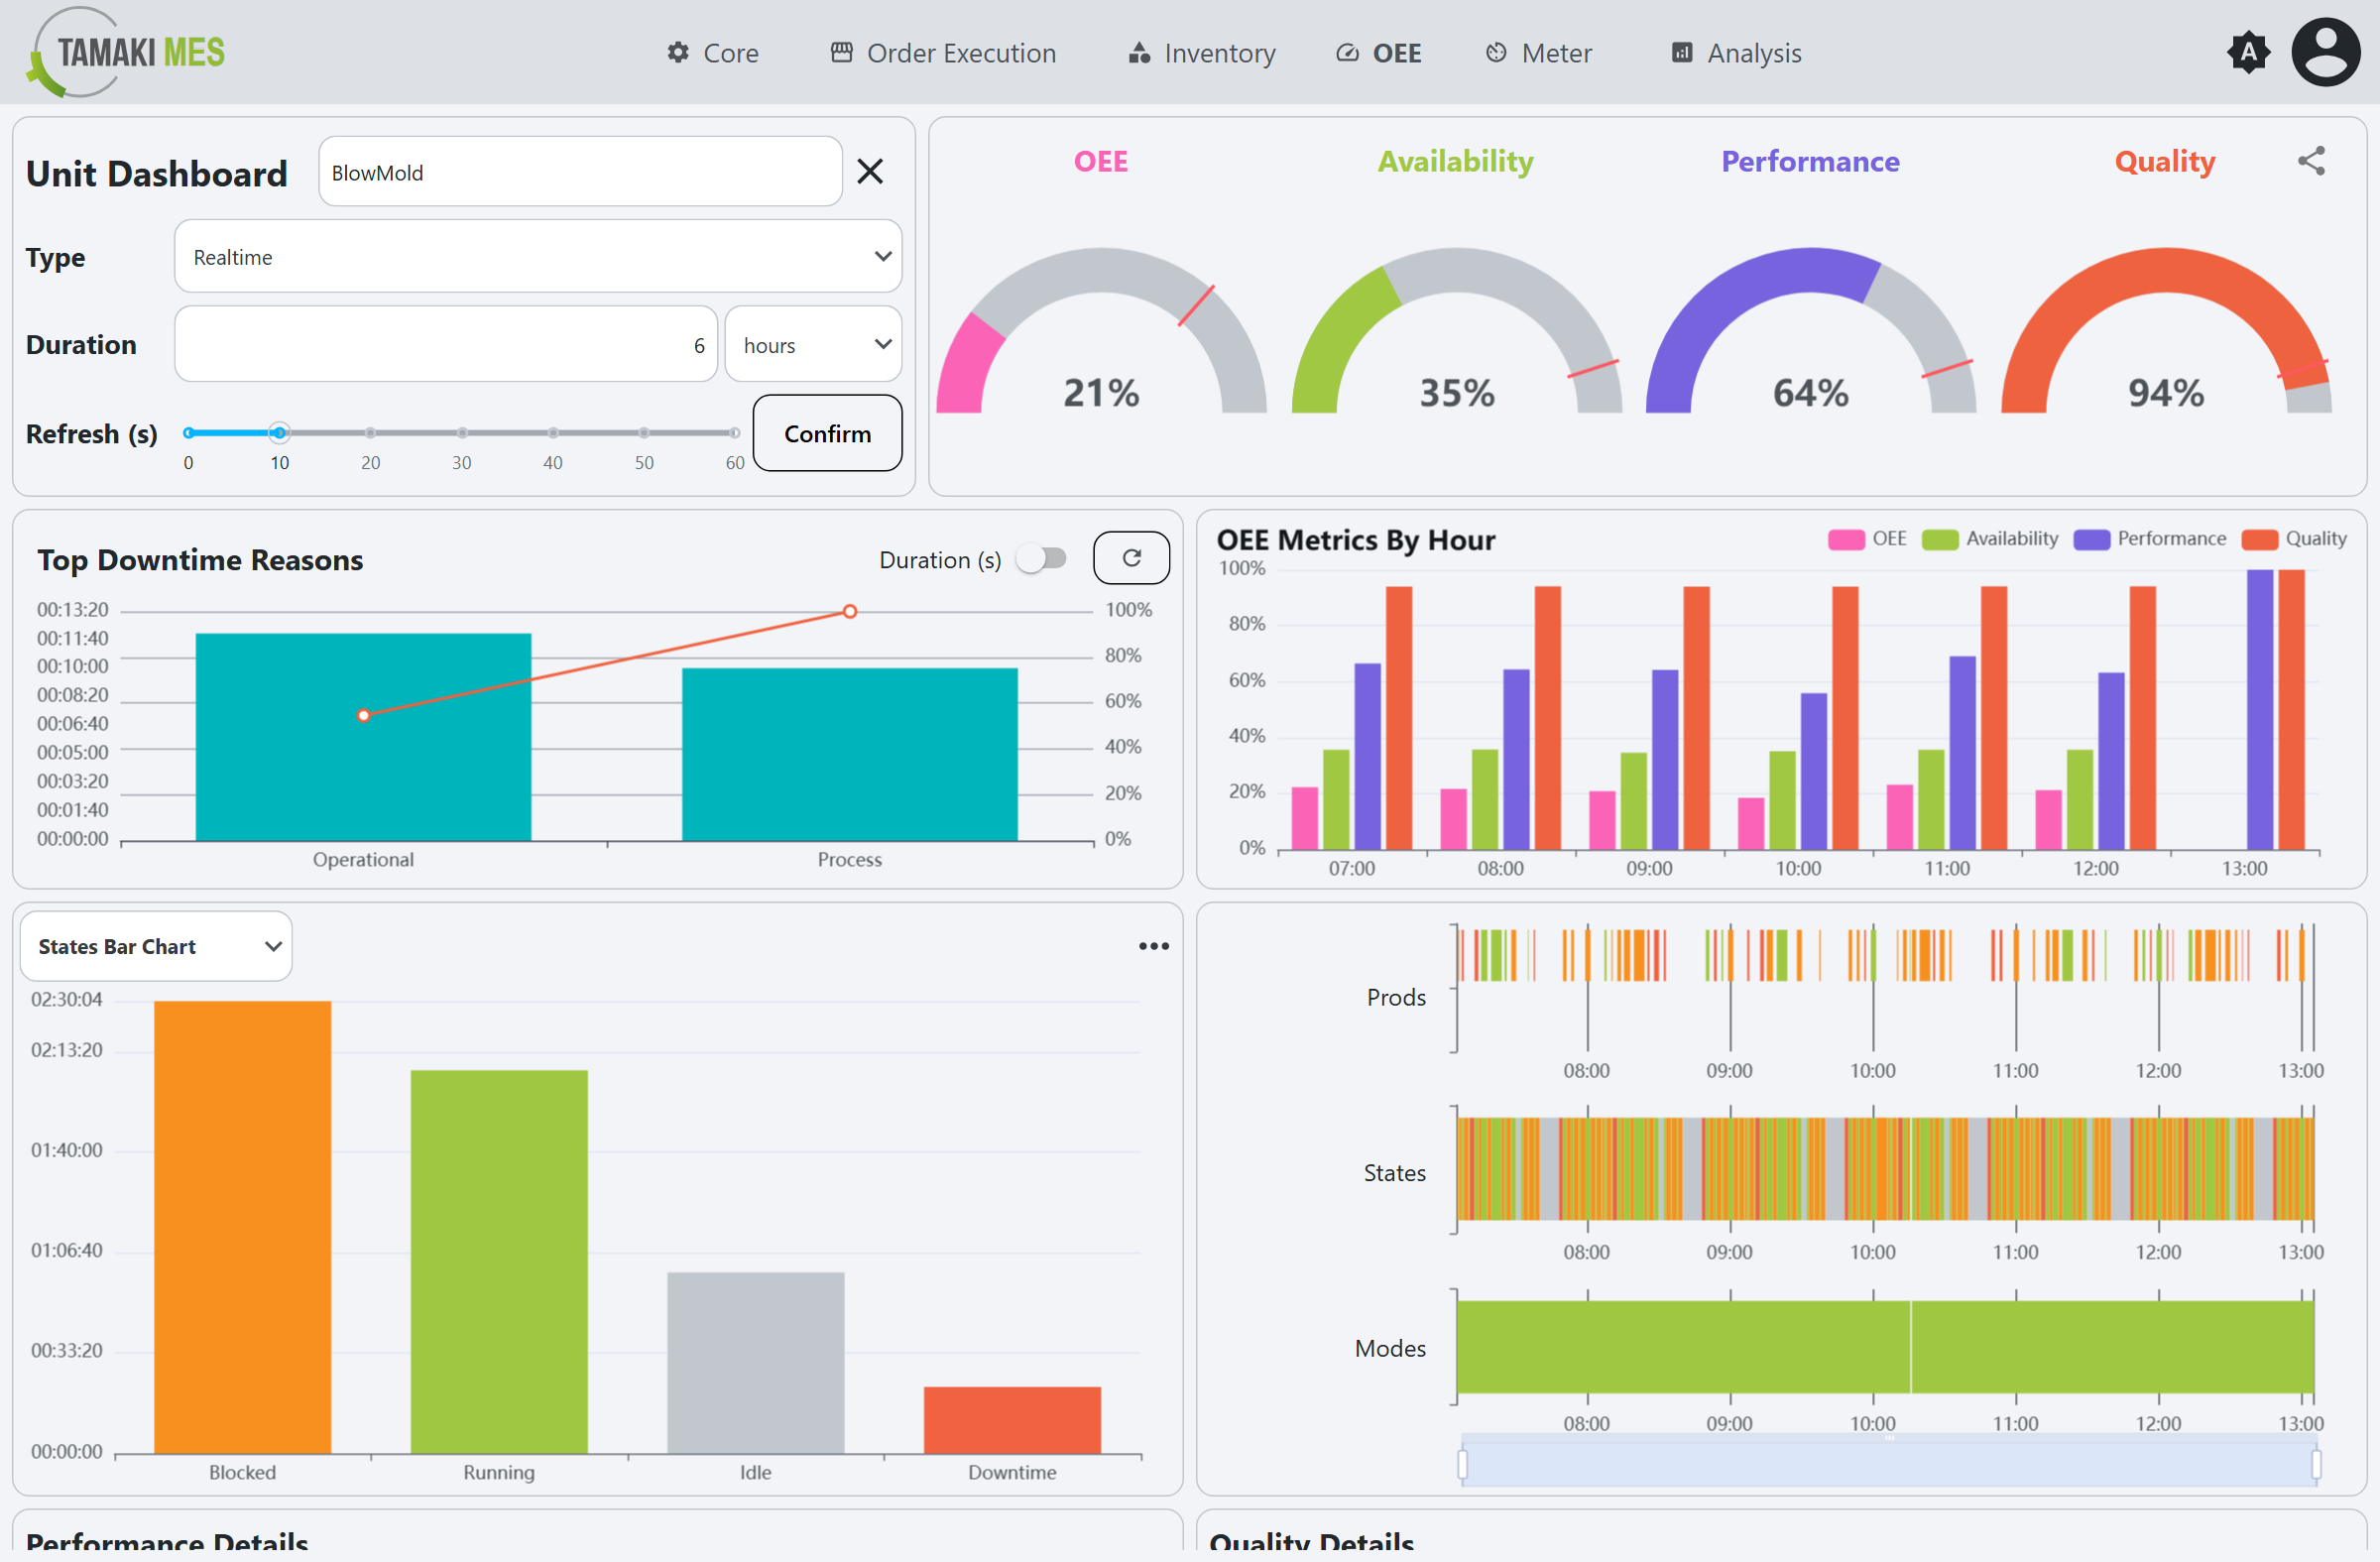
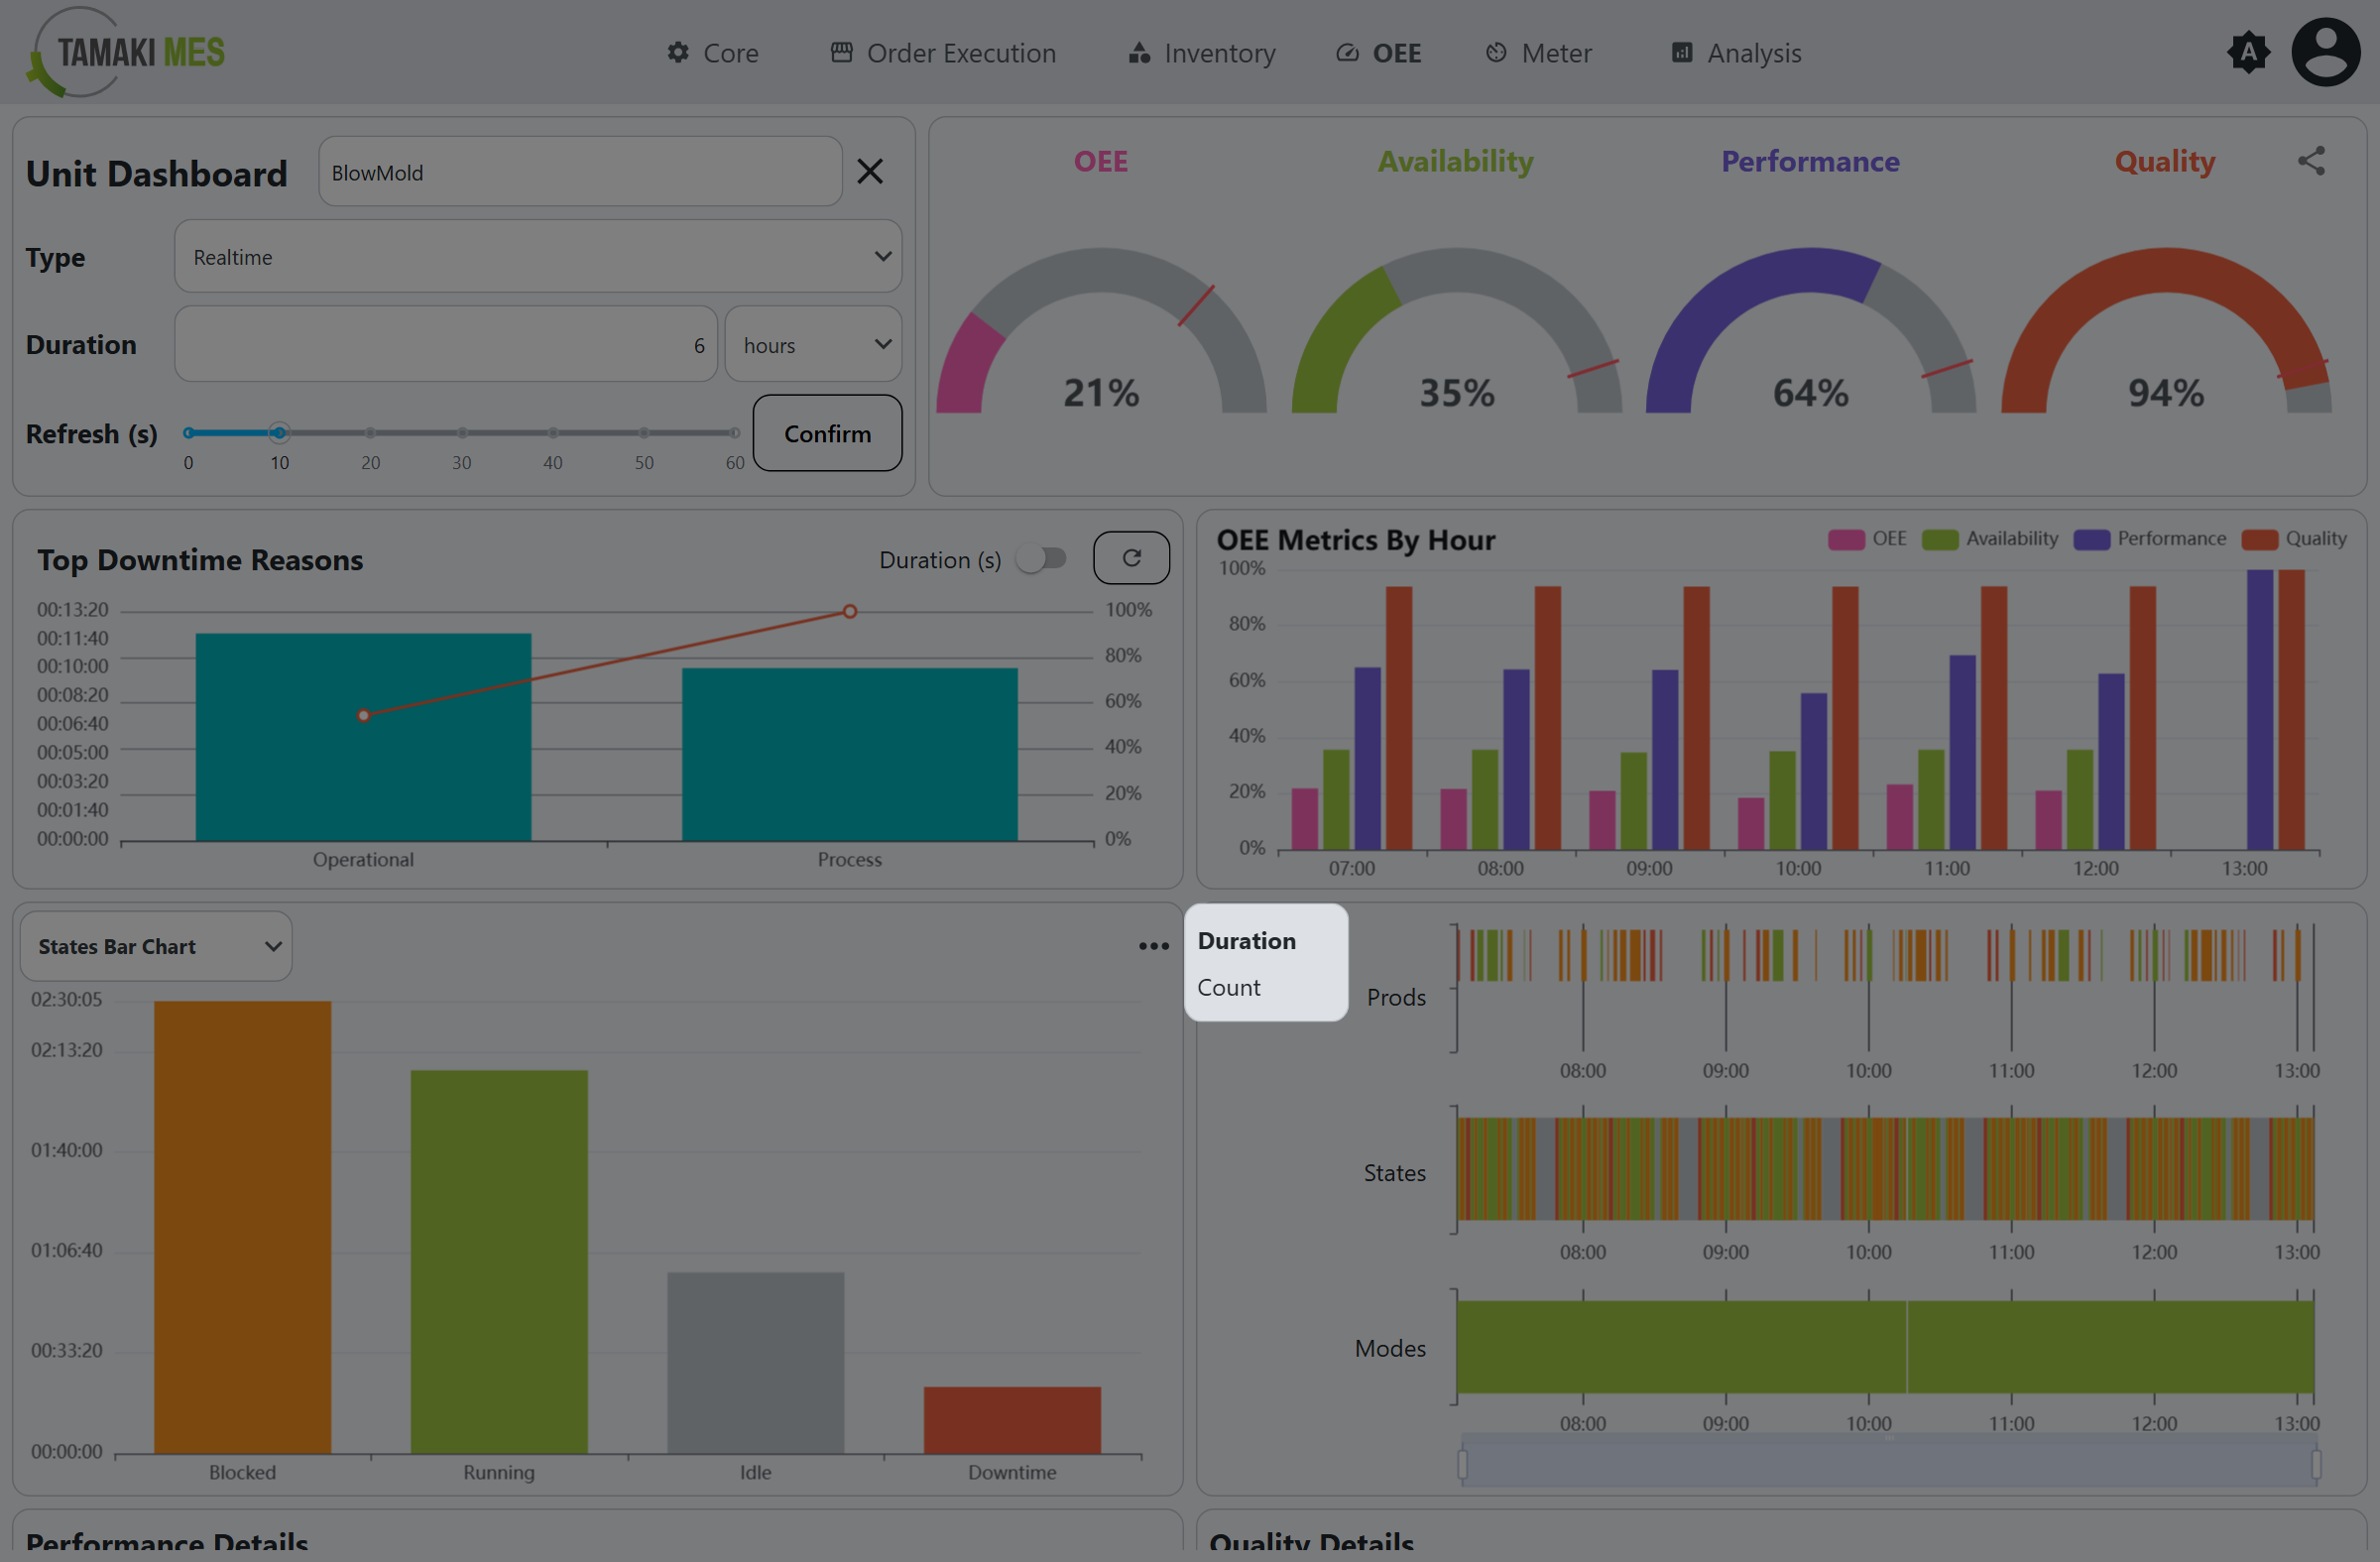
- The Unit Dashboard gives a detailed live or historical view of a single unit's performance: its OEE and component metrics, state and mode timelines, top downtime reasons, and performance and quality detail.
Components:
- Time Selection Sidebar
- OEE Gauges
- Top Downtime Reasons
- OEE Metrics by Hour
- State / Mode Chart
- Timelines
- Performance and Quality Details
Time Selection Sidebar
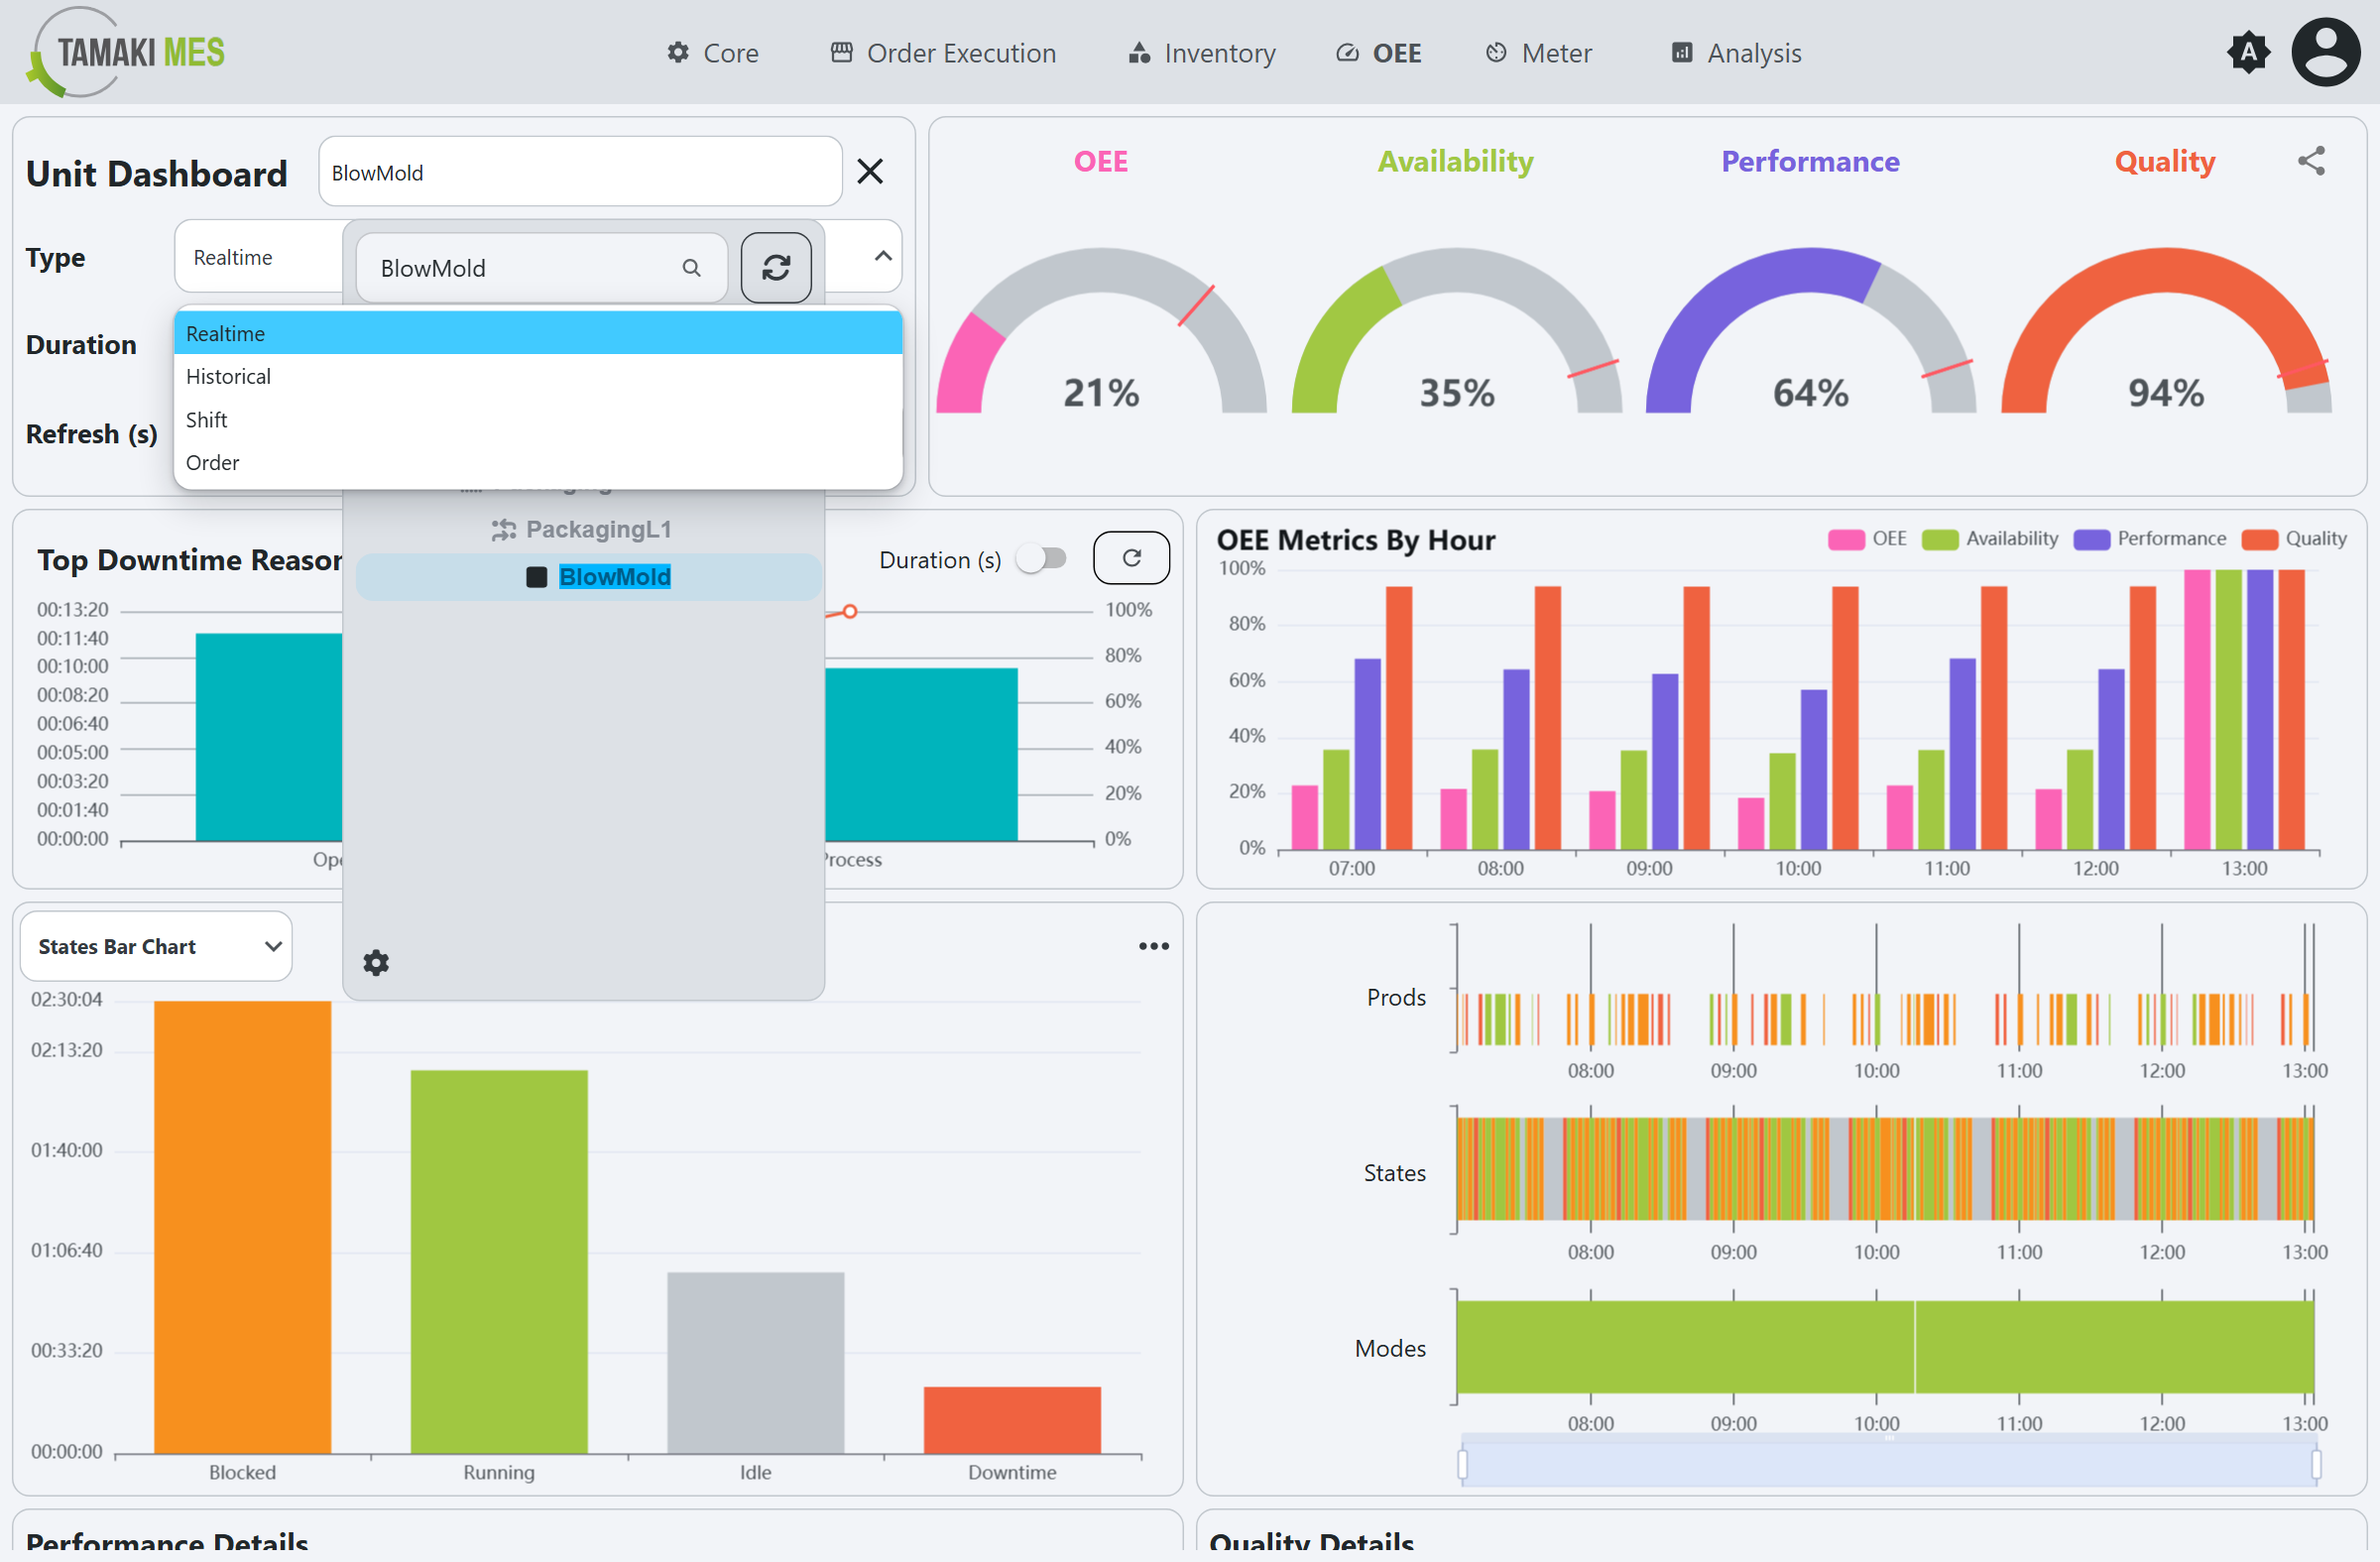
The sidebar (top left) selects the unit and the time window.
- Location - the unit to display, chosen from the location selector.
- Type - the time mode:
- Realtime: a rolling window ending now, refreshed automatically.
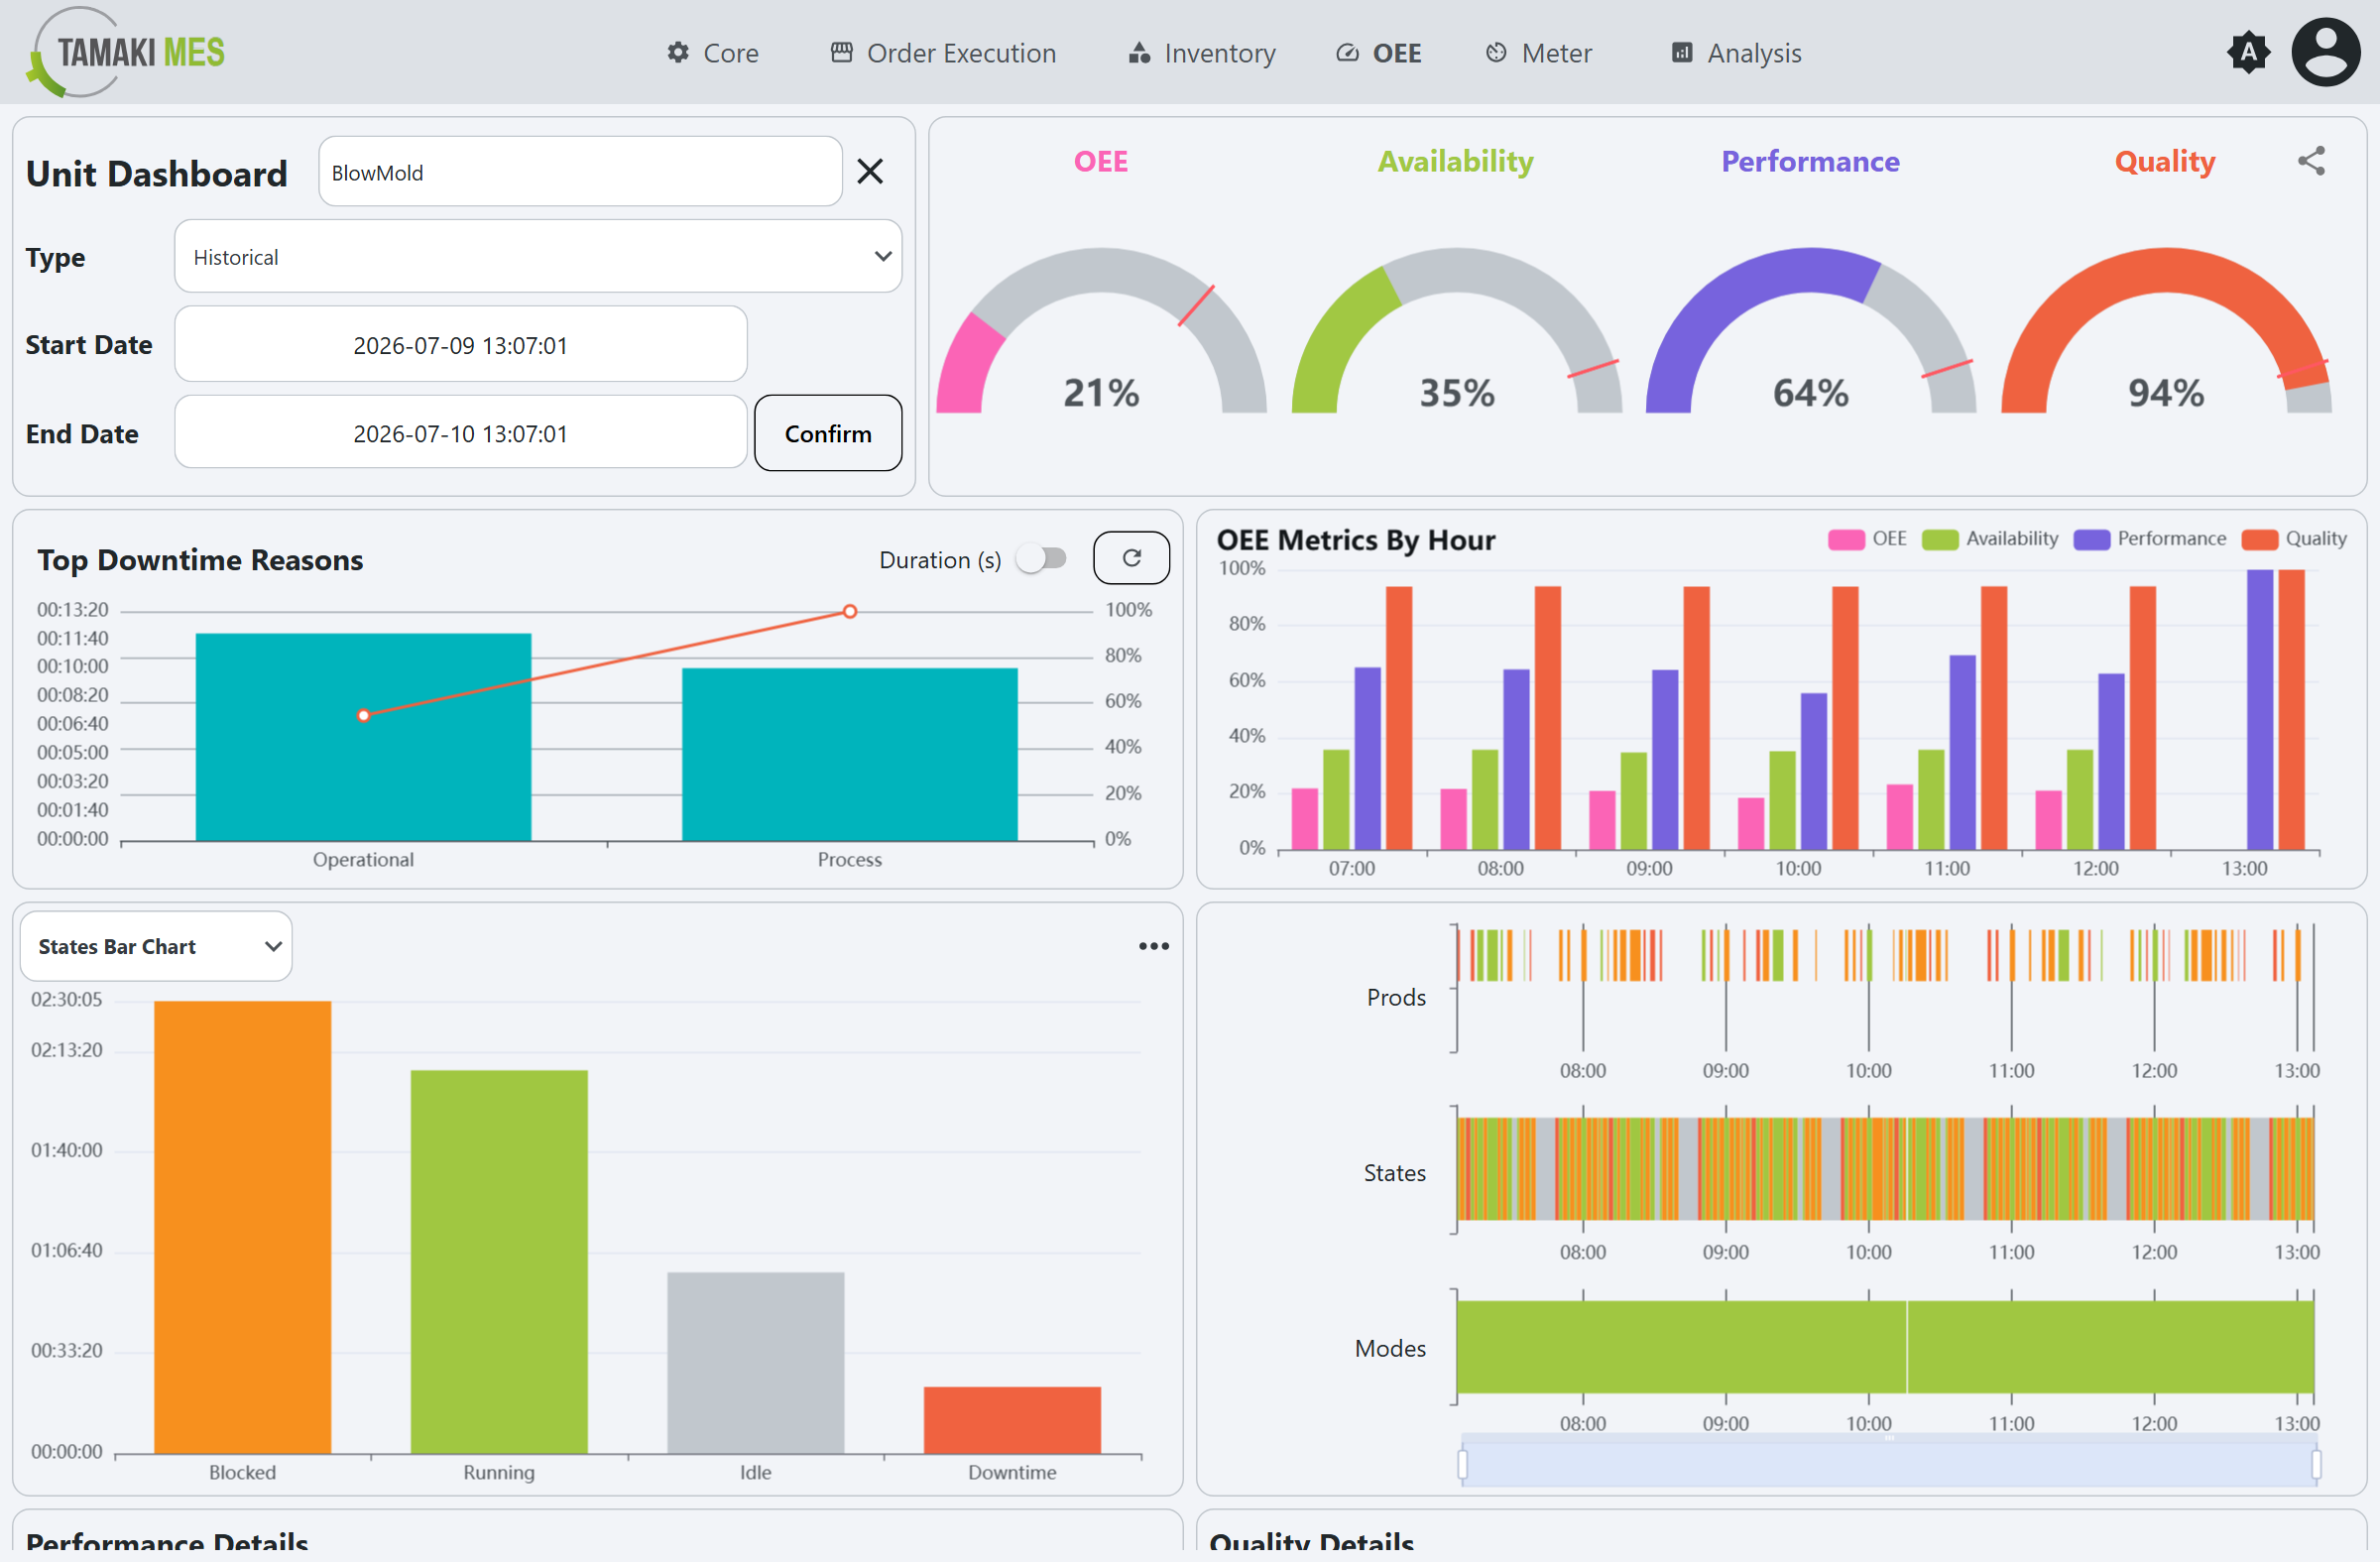
- Historical: a fixed start and end date.
- Shift: a specific shift instance.
- Order: the window of a production order.
- Duration - the length of the Realtime window (a number plus a unit, for example
6 hours). - Refresh (s) - how often the Realtime data refreshes (0-60 seconds).
- Confirm - applies the selection.
In Historical mode the Duration is replaced by Start Date and End Date pickers.
OEE Gauges
Four half-gauges across the top show the current OEE, Availability, Performance, and Quality for the selected window. The share icon exports or shares the dashboard.
Top Downtime Reasons
A Pareto chart of the most frequent Downtime Reasons, with bars for
each reason and a cumulative-percentage line. It defaults to the top-level reasons; click a bar to drill
into its children. The Duration (s) toggle switches the bars between event count and total duration.
OEE Metrics by Hour
A grouped bar chart of OEE, Availability, Performance, and Quality for each hour in the window, for spotting the times of day where performance drops.
State / Mode Chart
A chart whose type is chosen from the selector in its header:
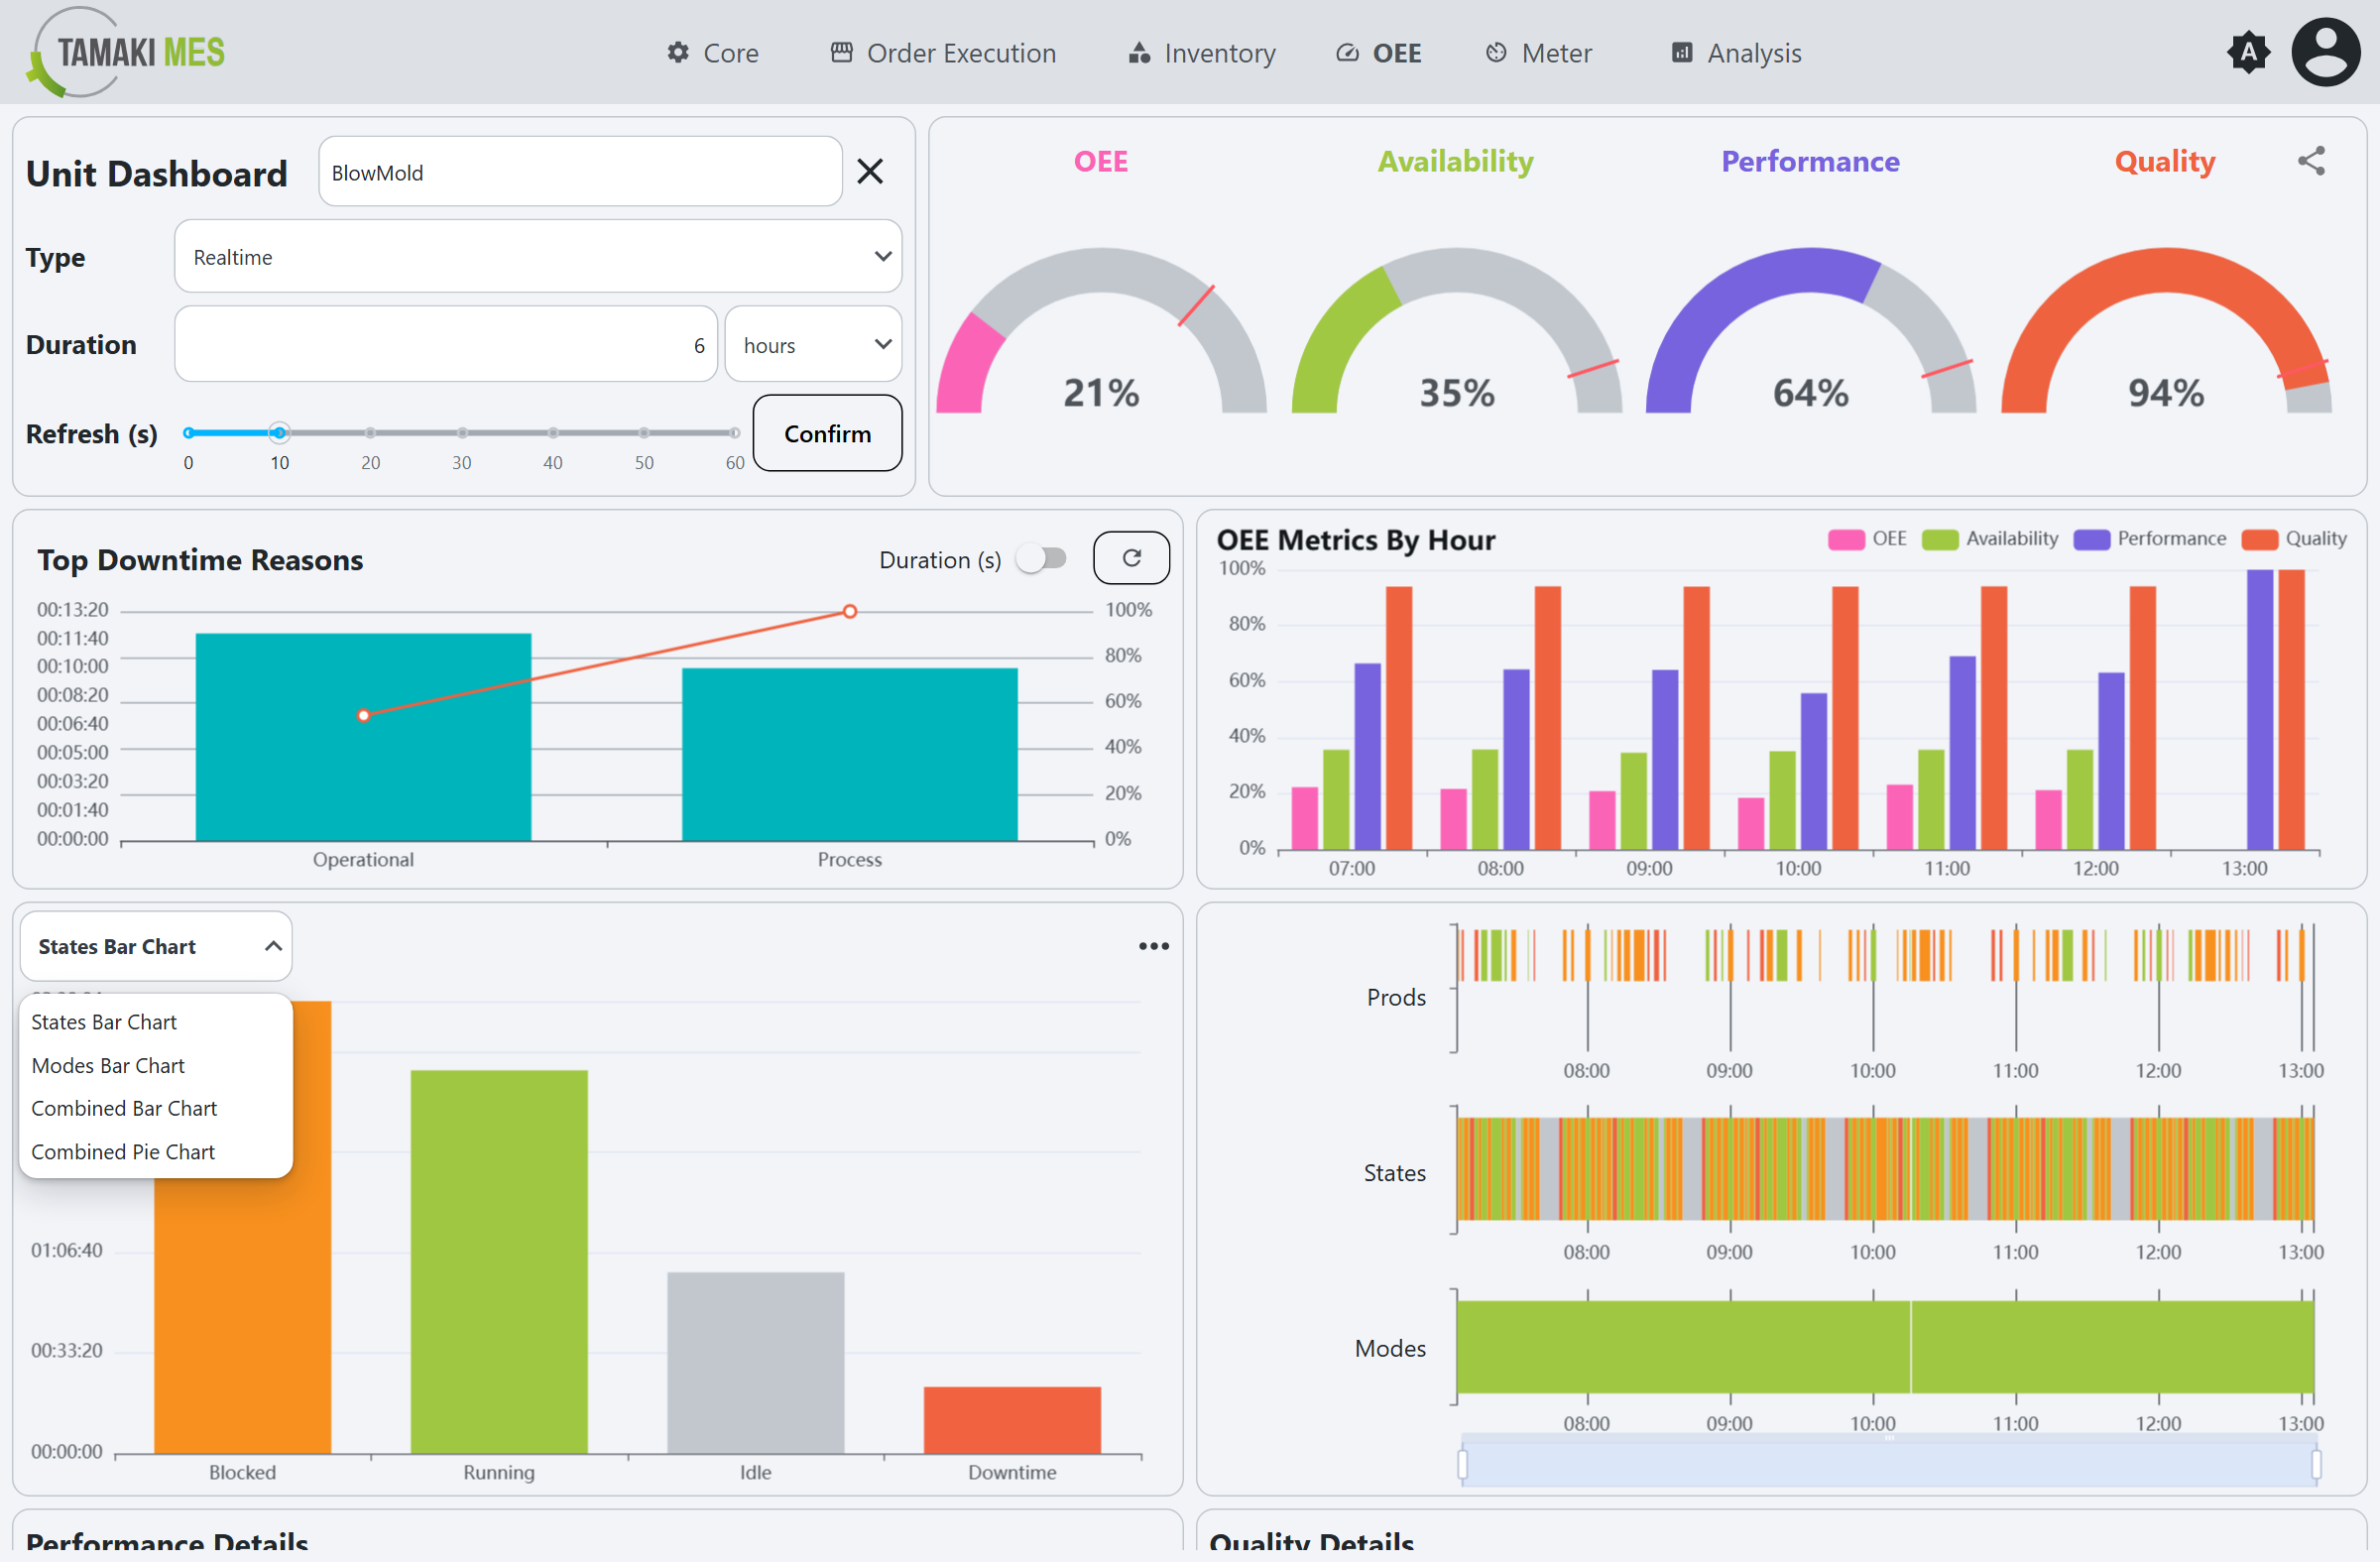
- States Bar Chart - total time in each State.
- Modes Bar Chart - total time in each Mode.
- Combined Bar Chart - states and modes together.
- Combined Pie Chart - the time distribution across states and modes, color-coded to match their configuration.
The ... menu on the panel toggles the values between Duration and Count.
Timelines
Three color-coded swim-lanes - Prods, States, and Modes - show the unit's production, state, and mode history across the window. The scrubber at the bottom zooms and pans the time axis. Hover a segment for its details; click a segment to open an event popup.
State event popup
Clicking a States segment opens the state record:
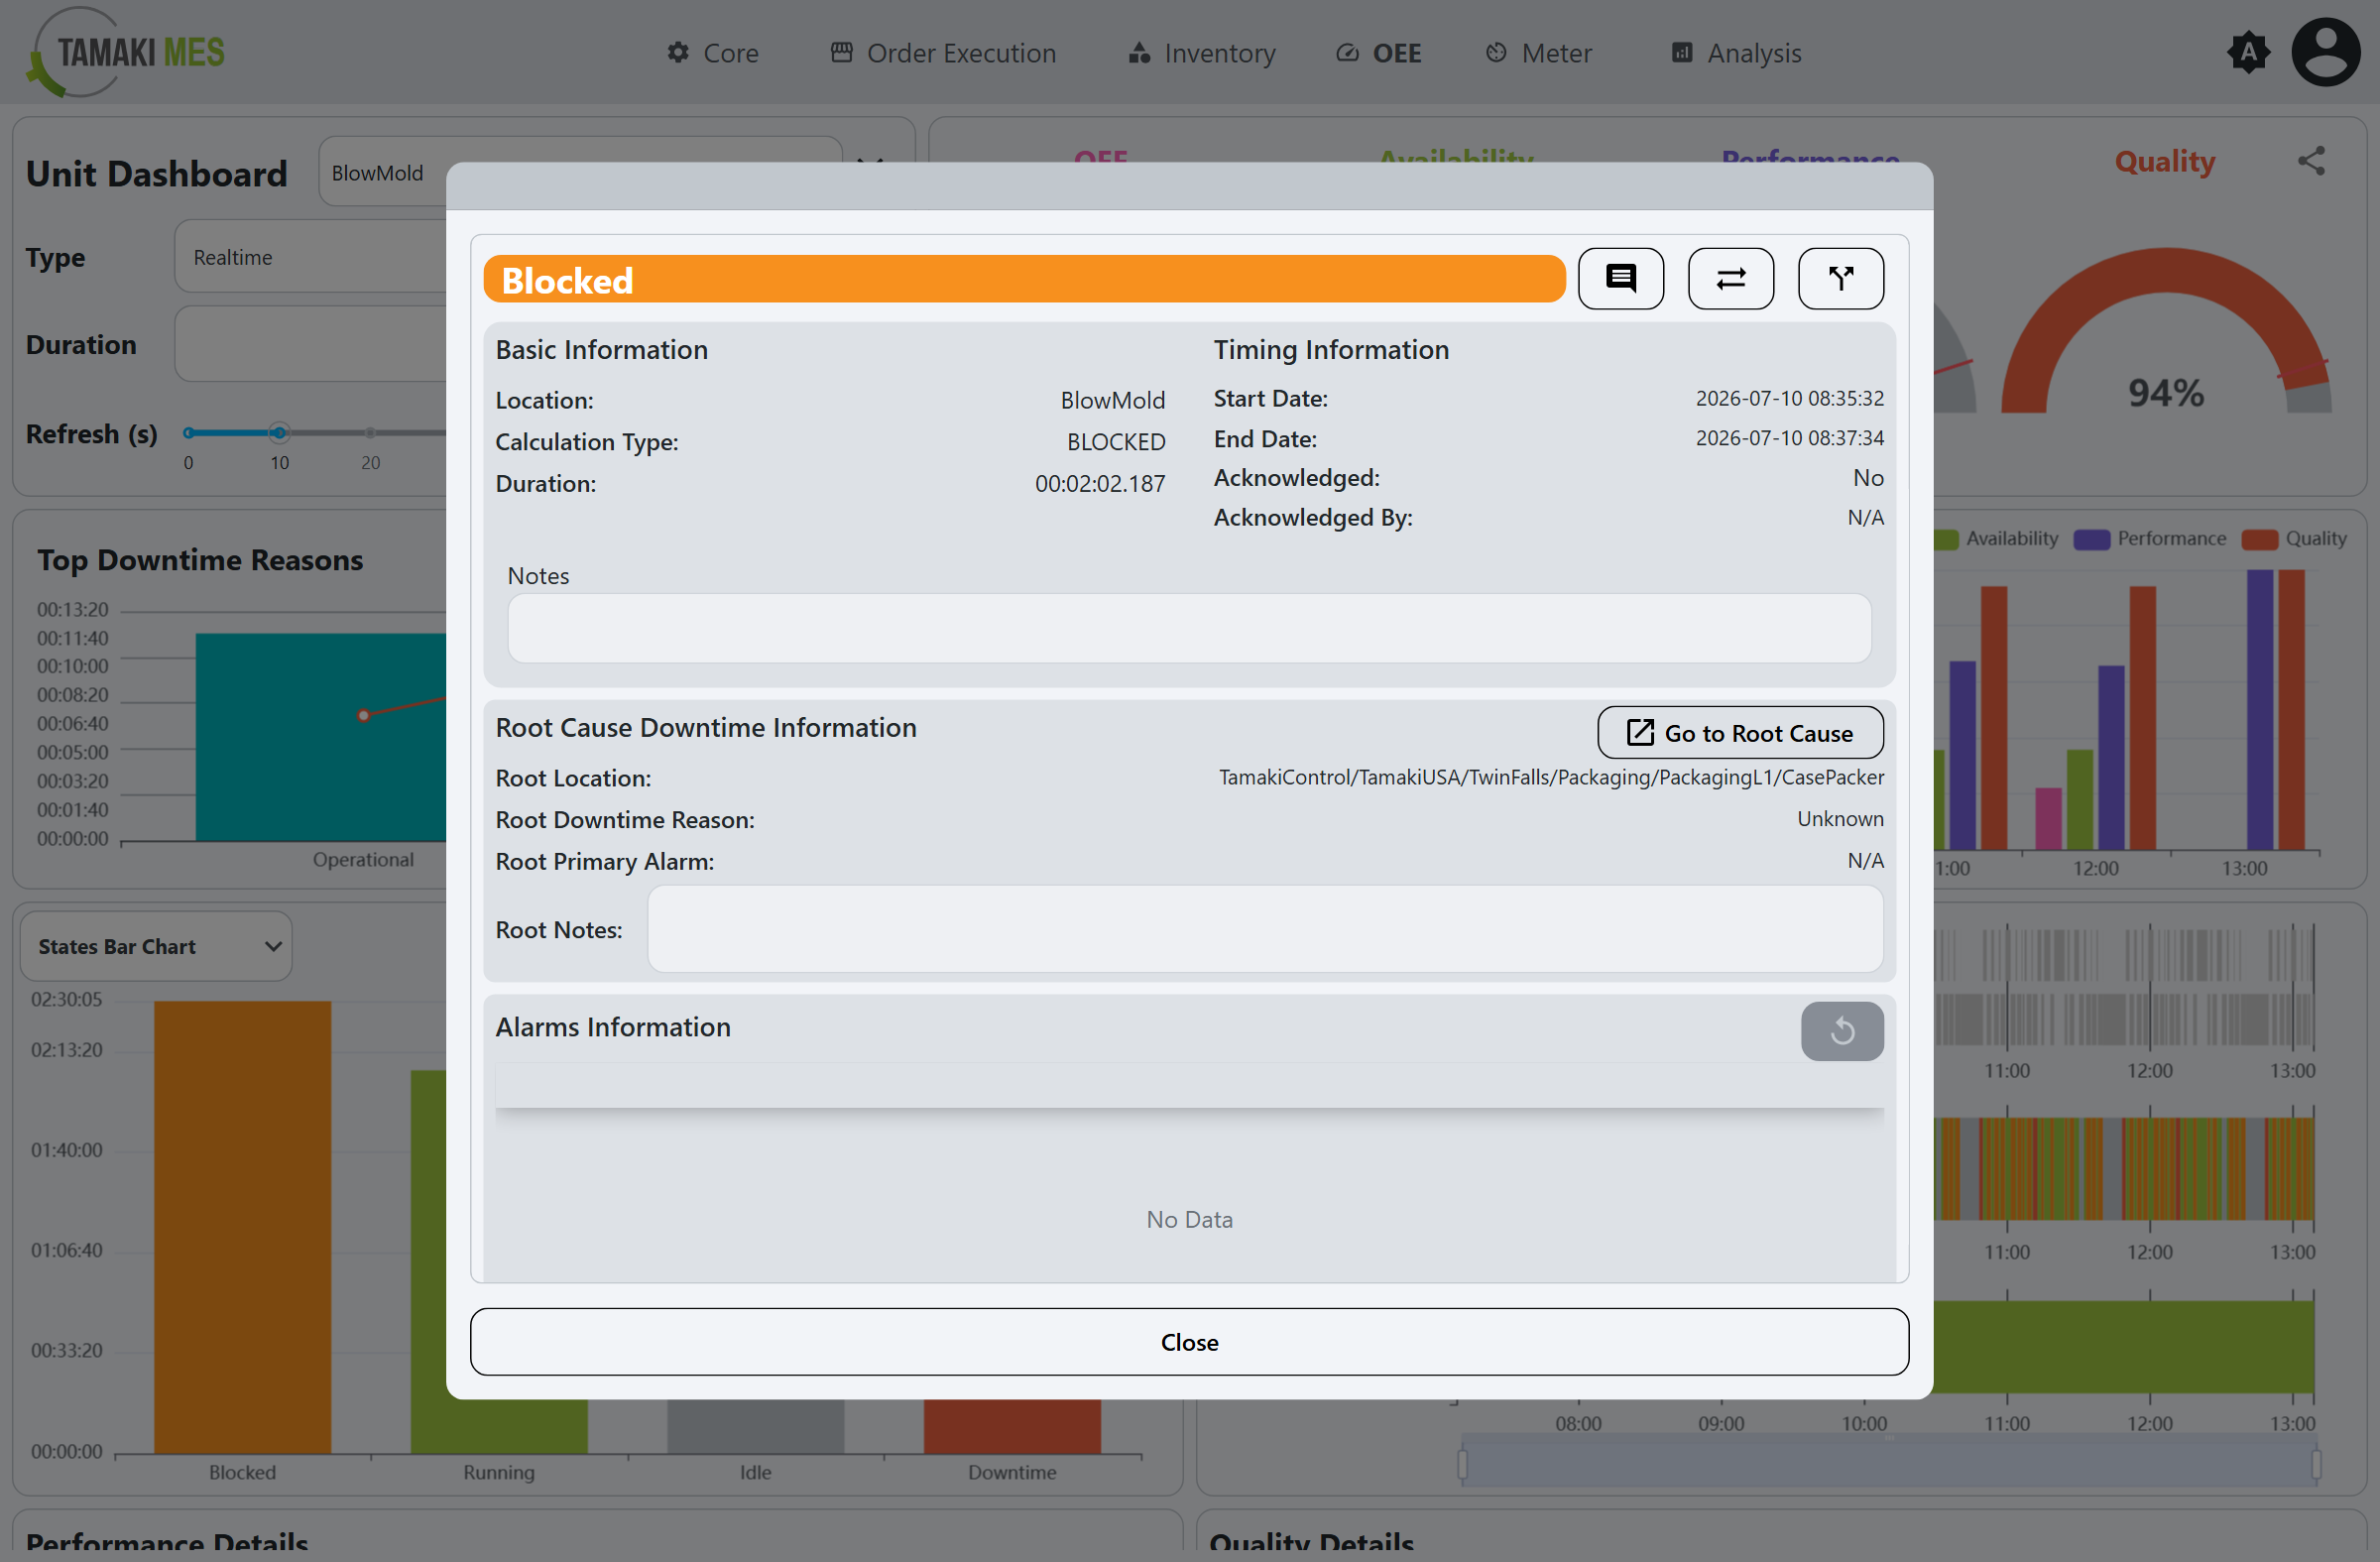
- Basic Information: Location, Calculation Type, Duration.
- Timing Information: Start Date, End Date, Acknowledged, Acknowledged By.
- Notes.
- Root Cause Downtime Information: Root Location, Root Downtime Reason, Root Primary Alarm, Root Notes, plus a Go to Root Cause button that jumps to the responsible interruption location.
- Alarms Information: the alarms captured during the event.
The header icons open the state-record edit actions:
| Action | Popup |
|---|---|
| Set Notes | 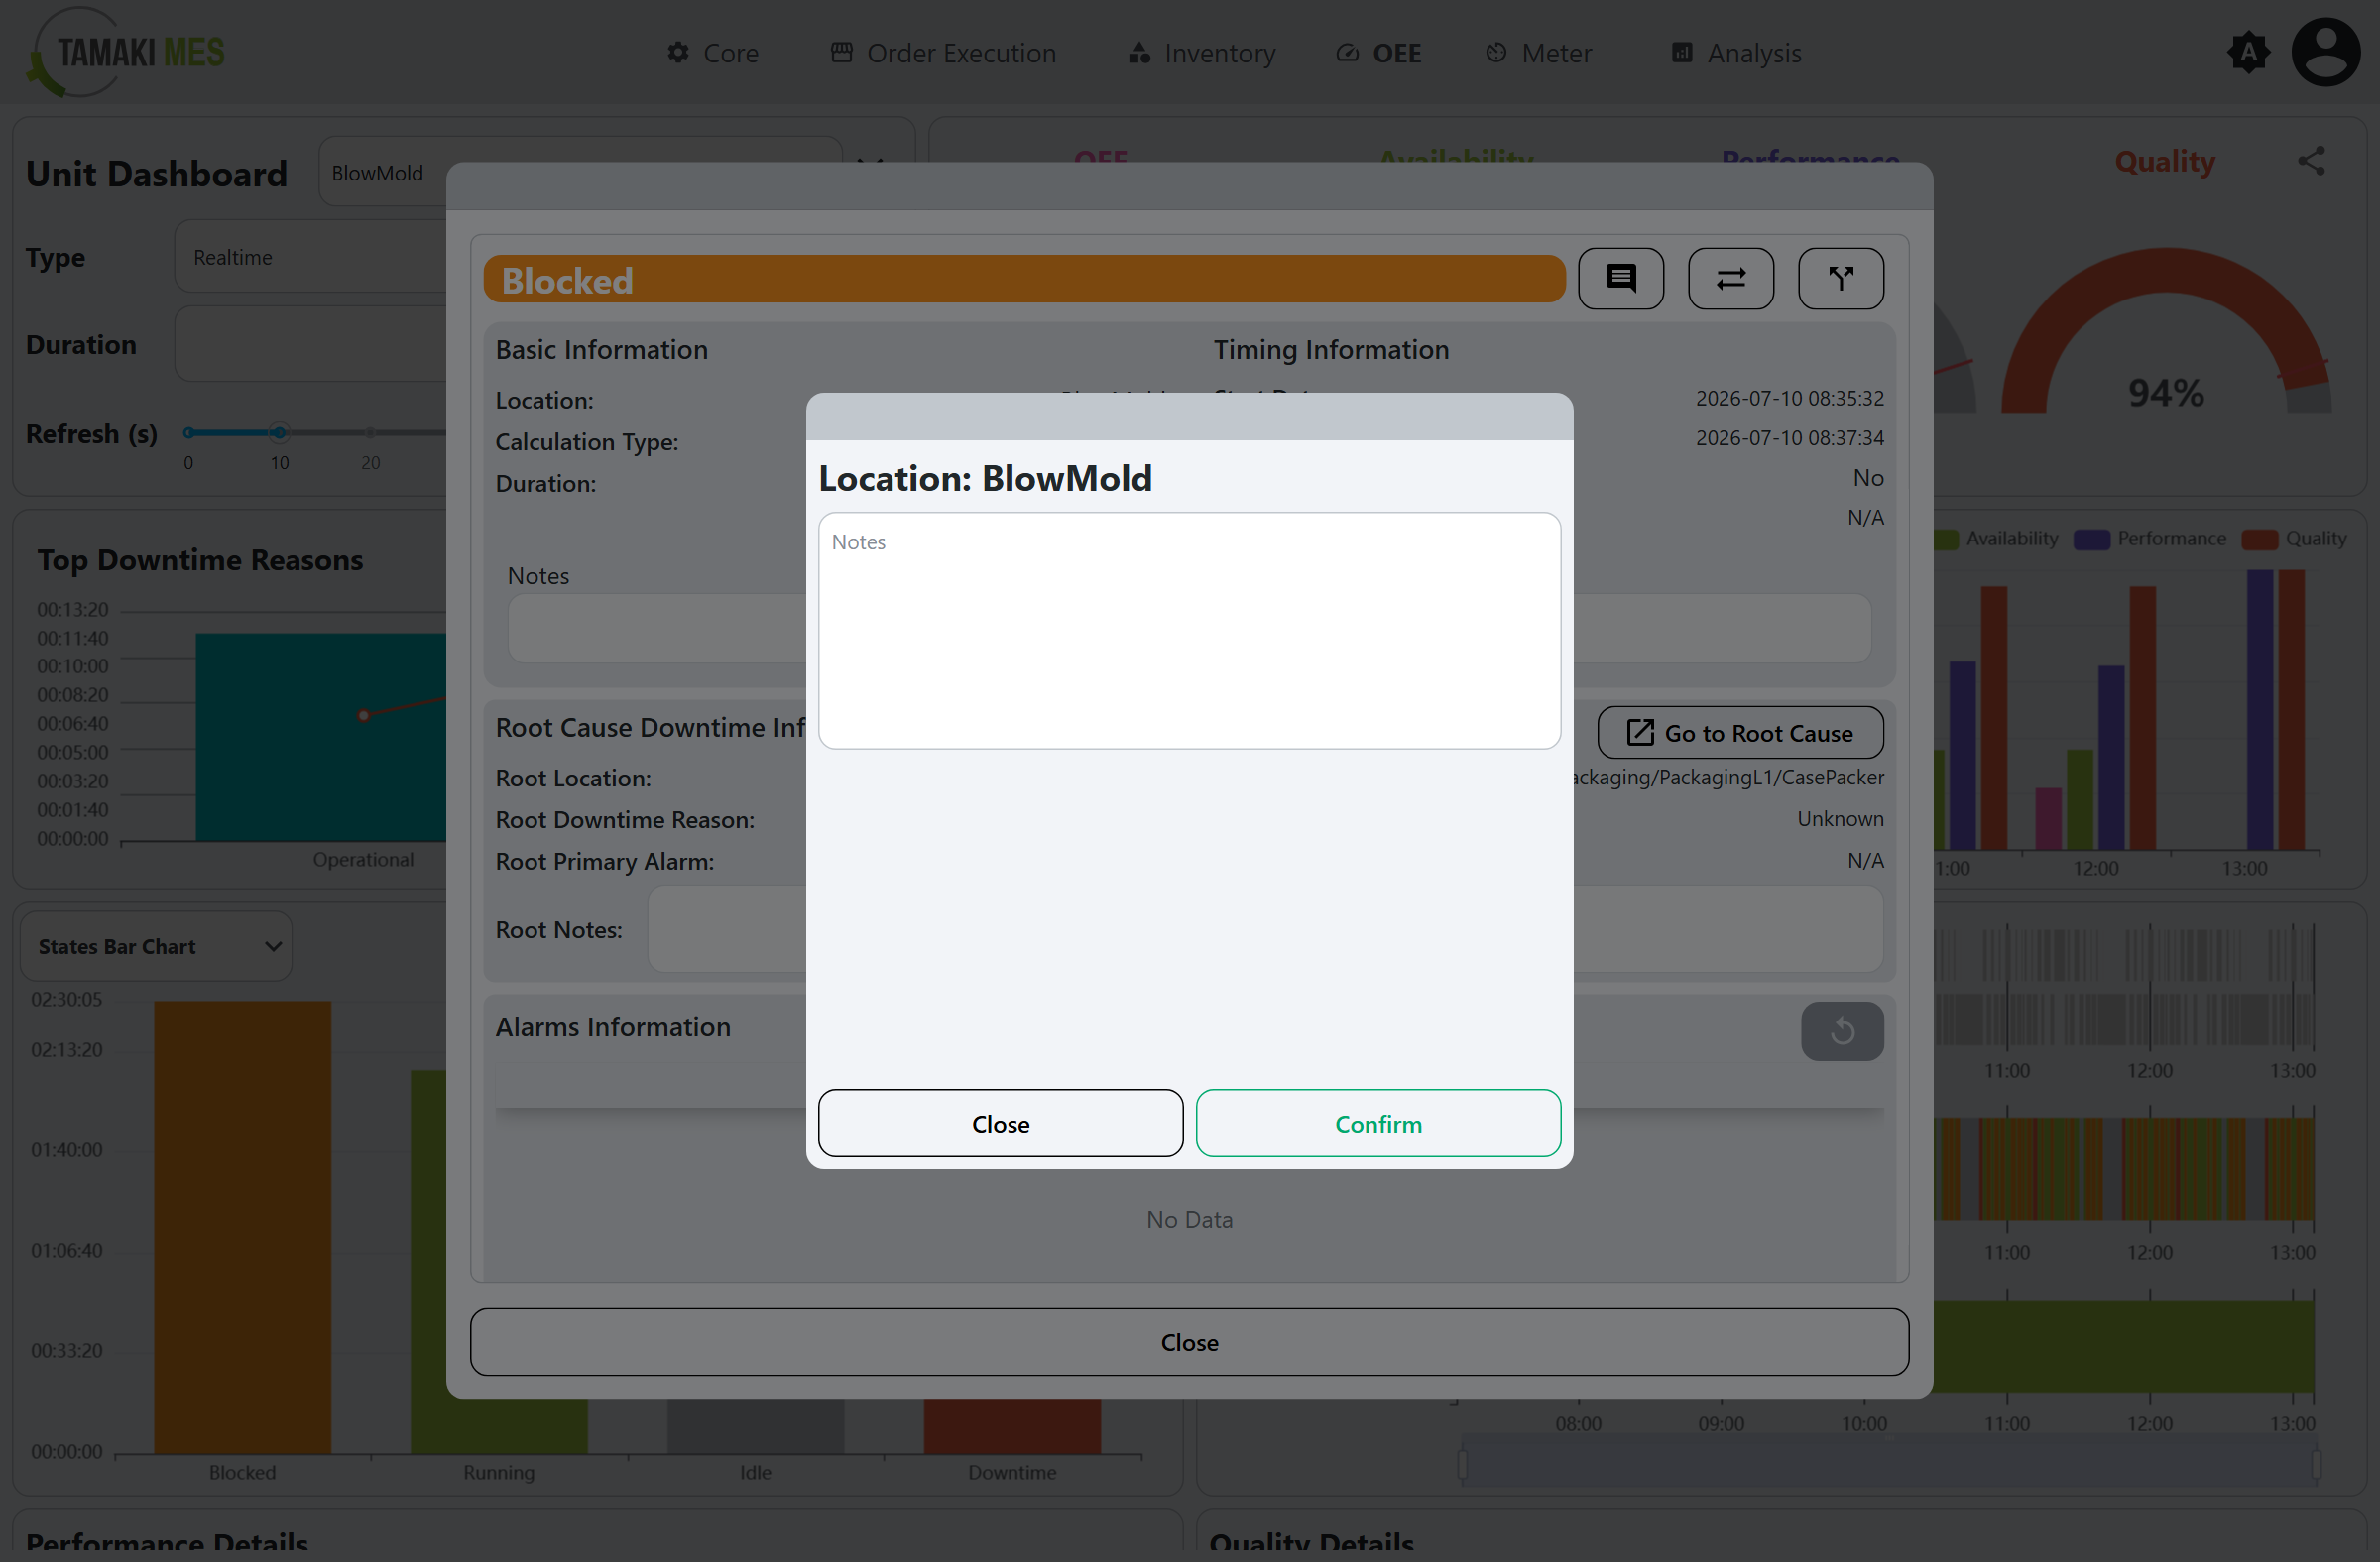 |
| Reassign State | 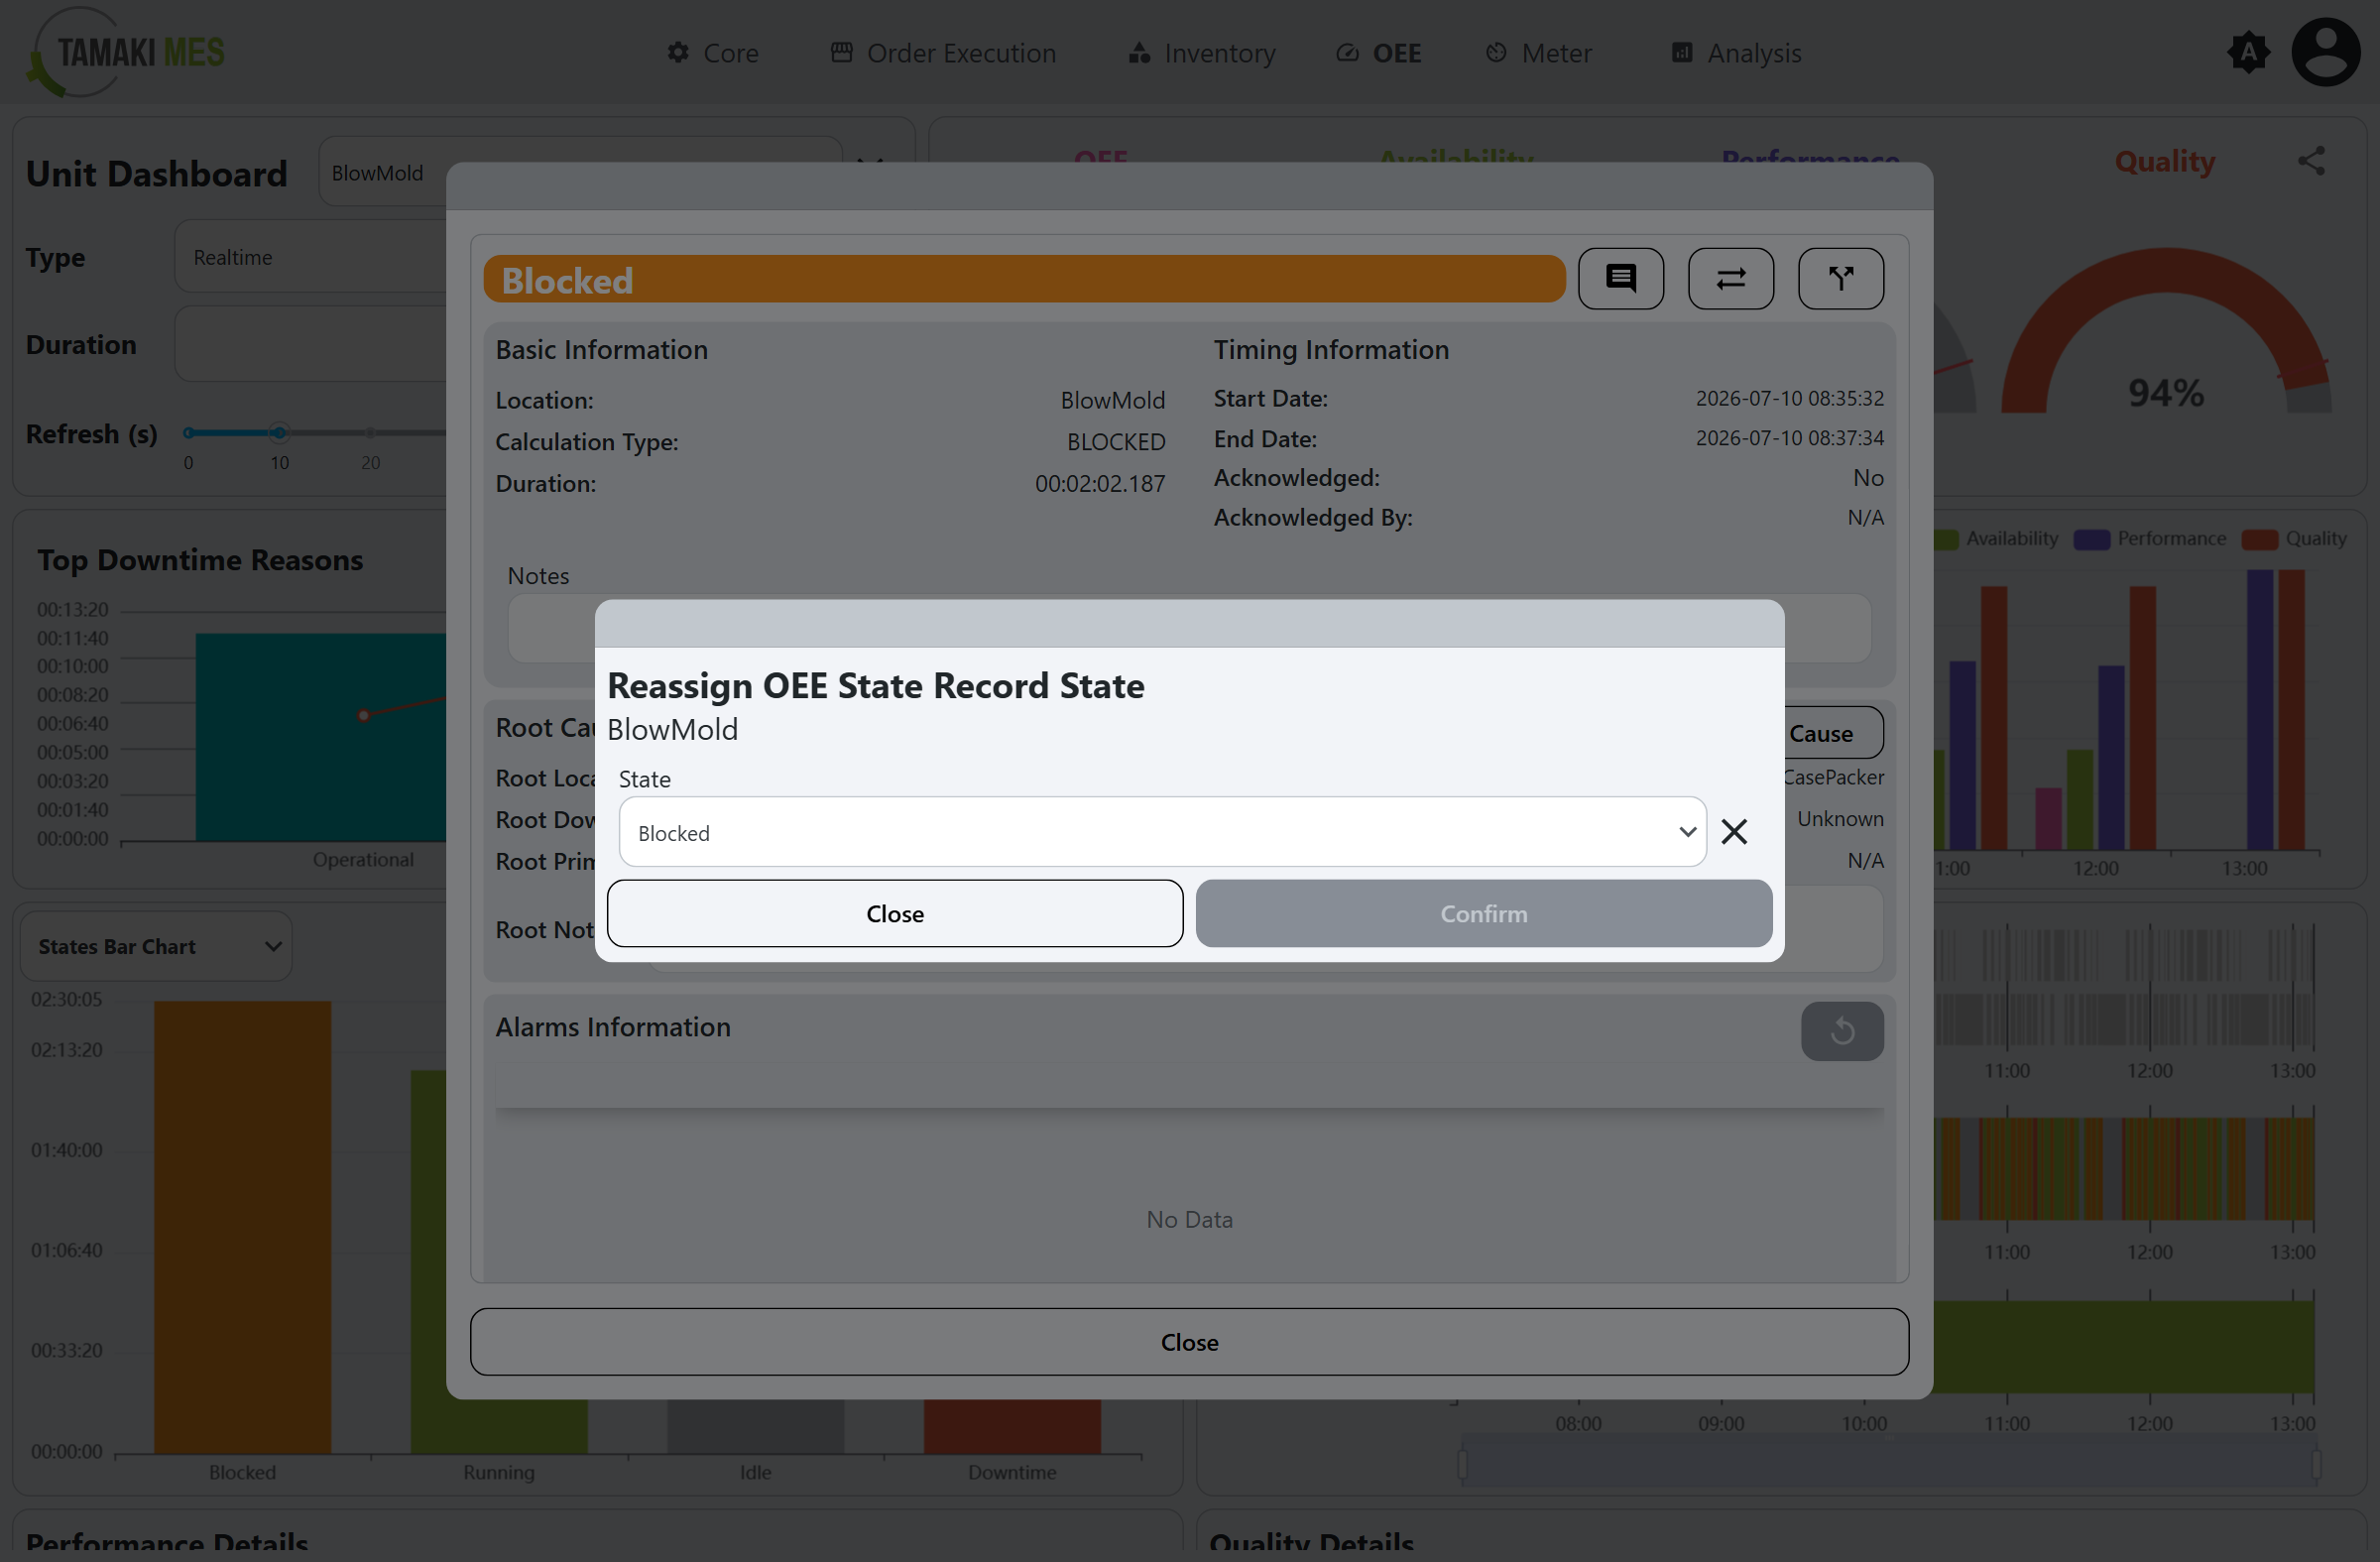 |
| Split | 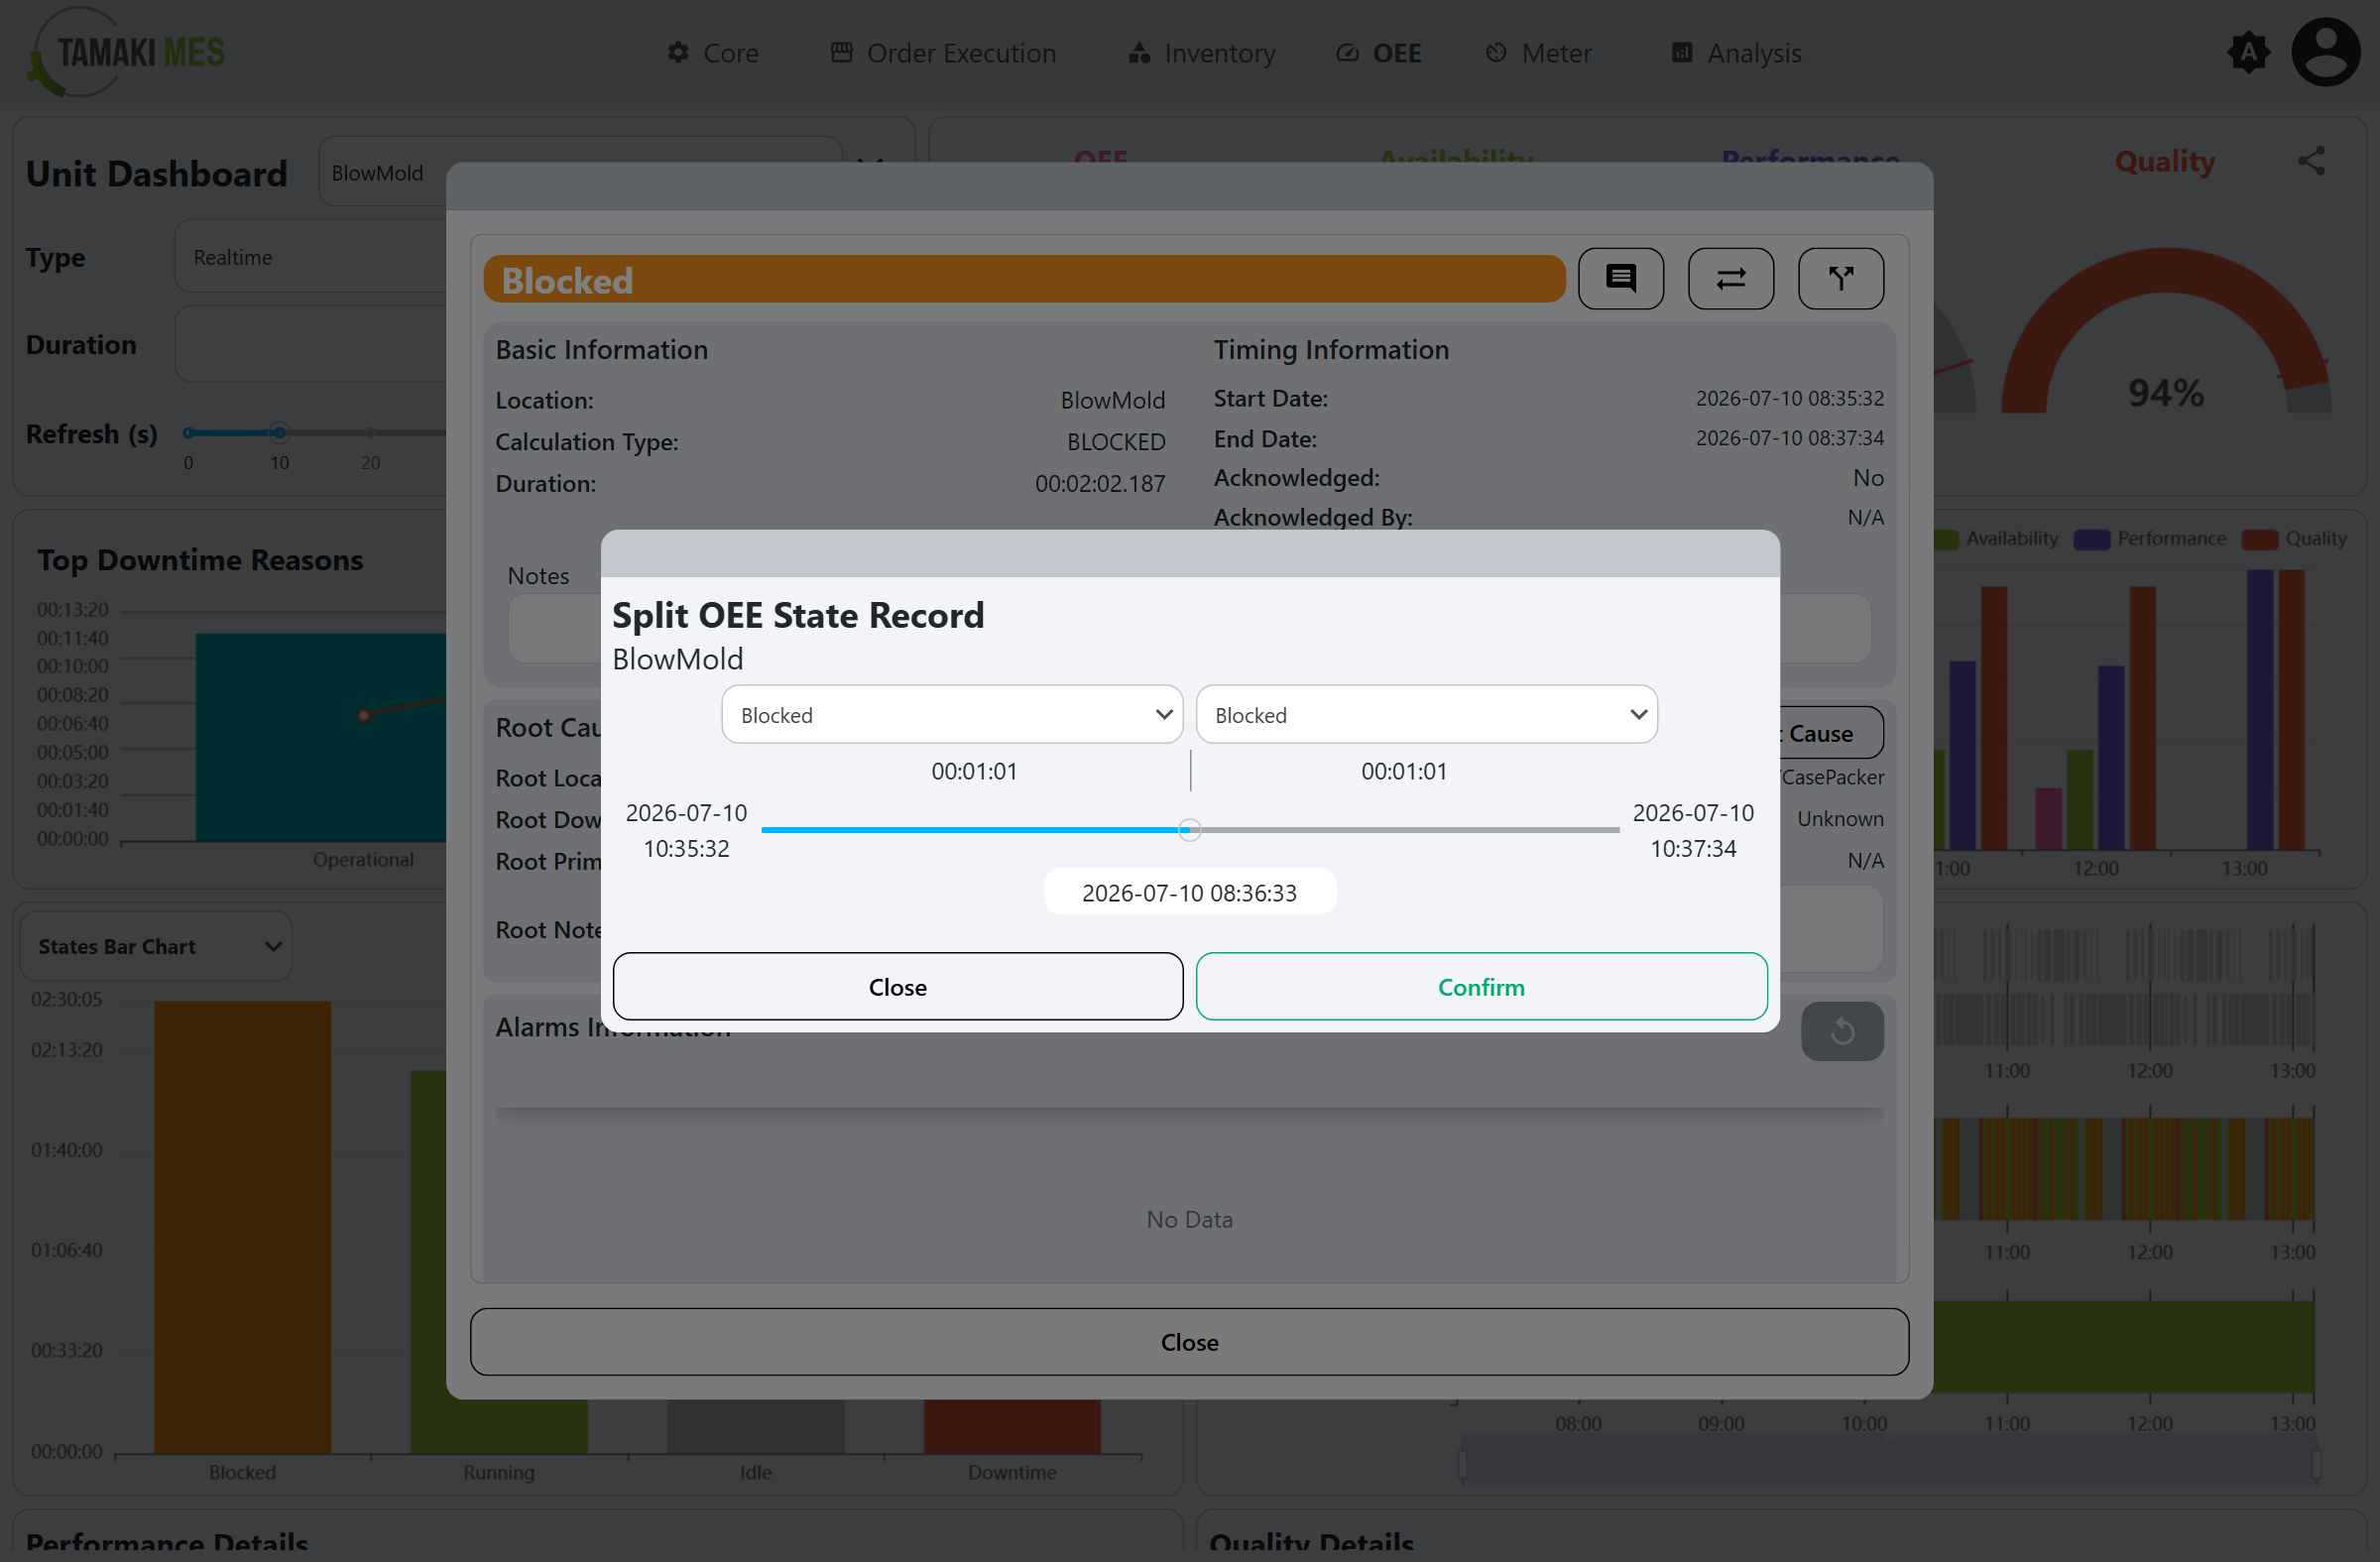 |
- Reassign State changes the recorded State of the event.
- Split divides the event into two at a chosen point, assigning a state to each part.
Mode event popup
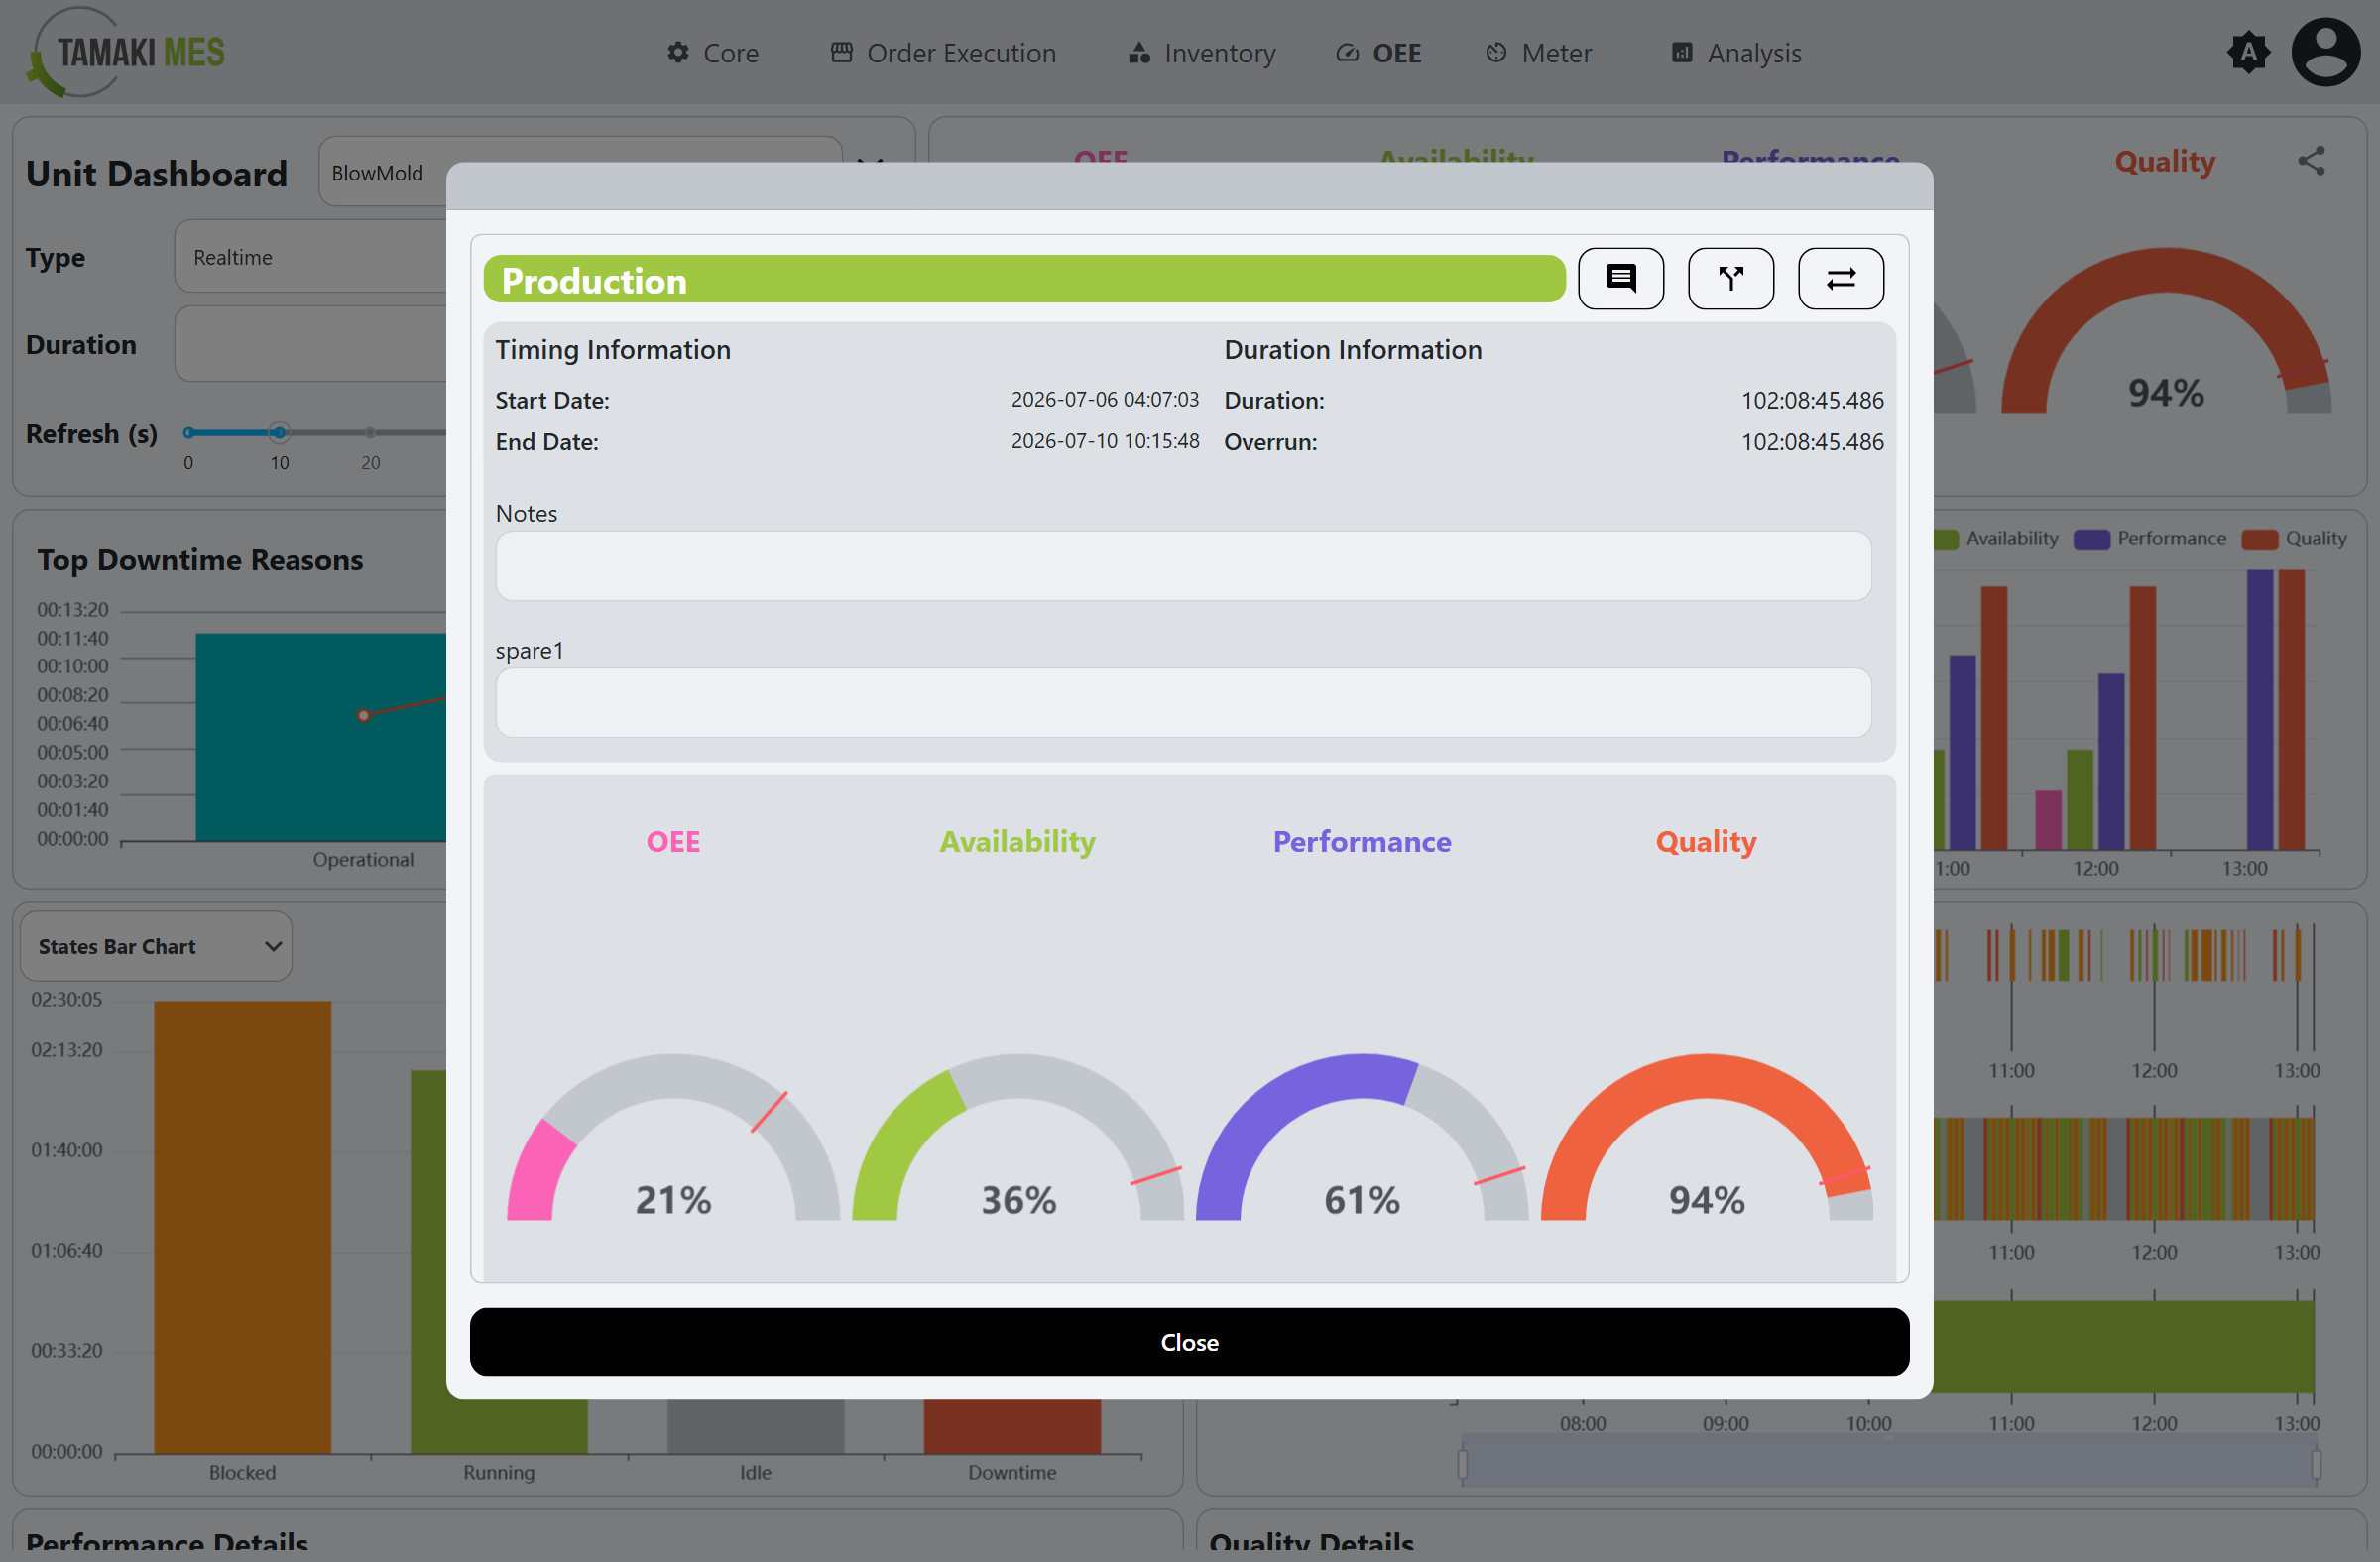
Clicking a Modes segment opens the mode record, showing its timing, Duration and Overrun (time over the mode's expected duration), notes, and mini OEE gauges for the mode.
Performance and Quality Details
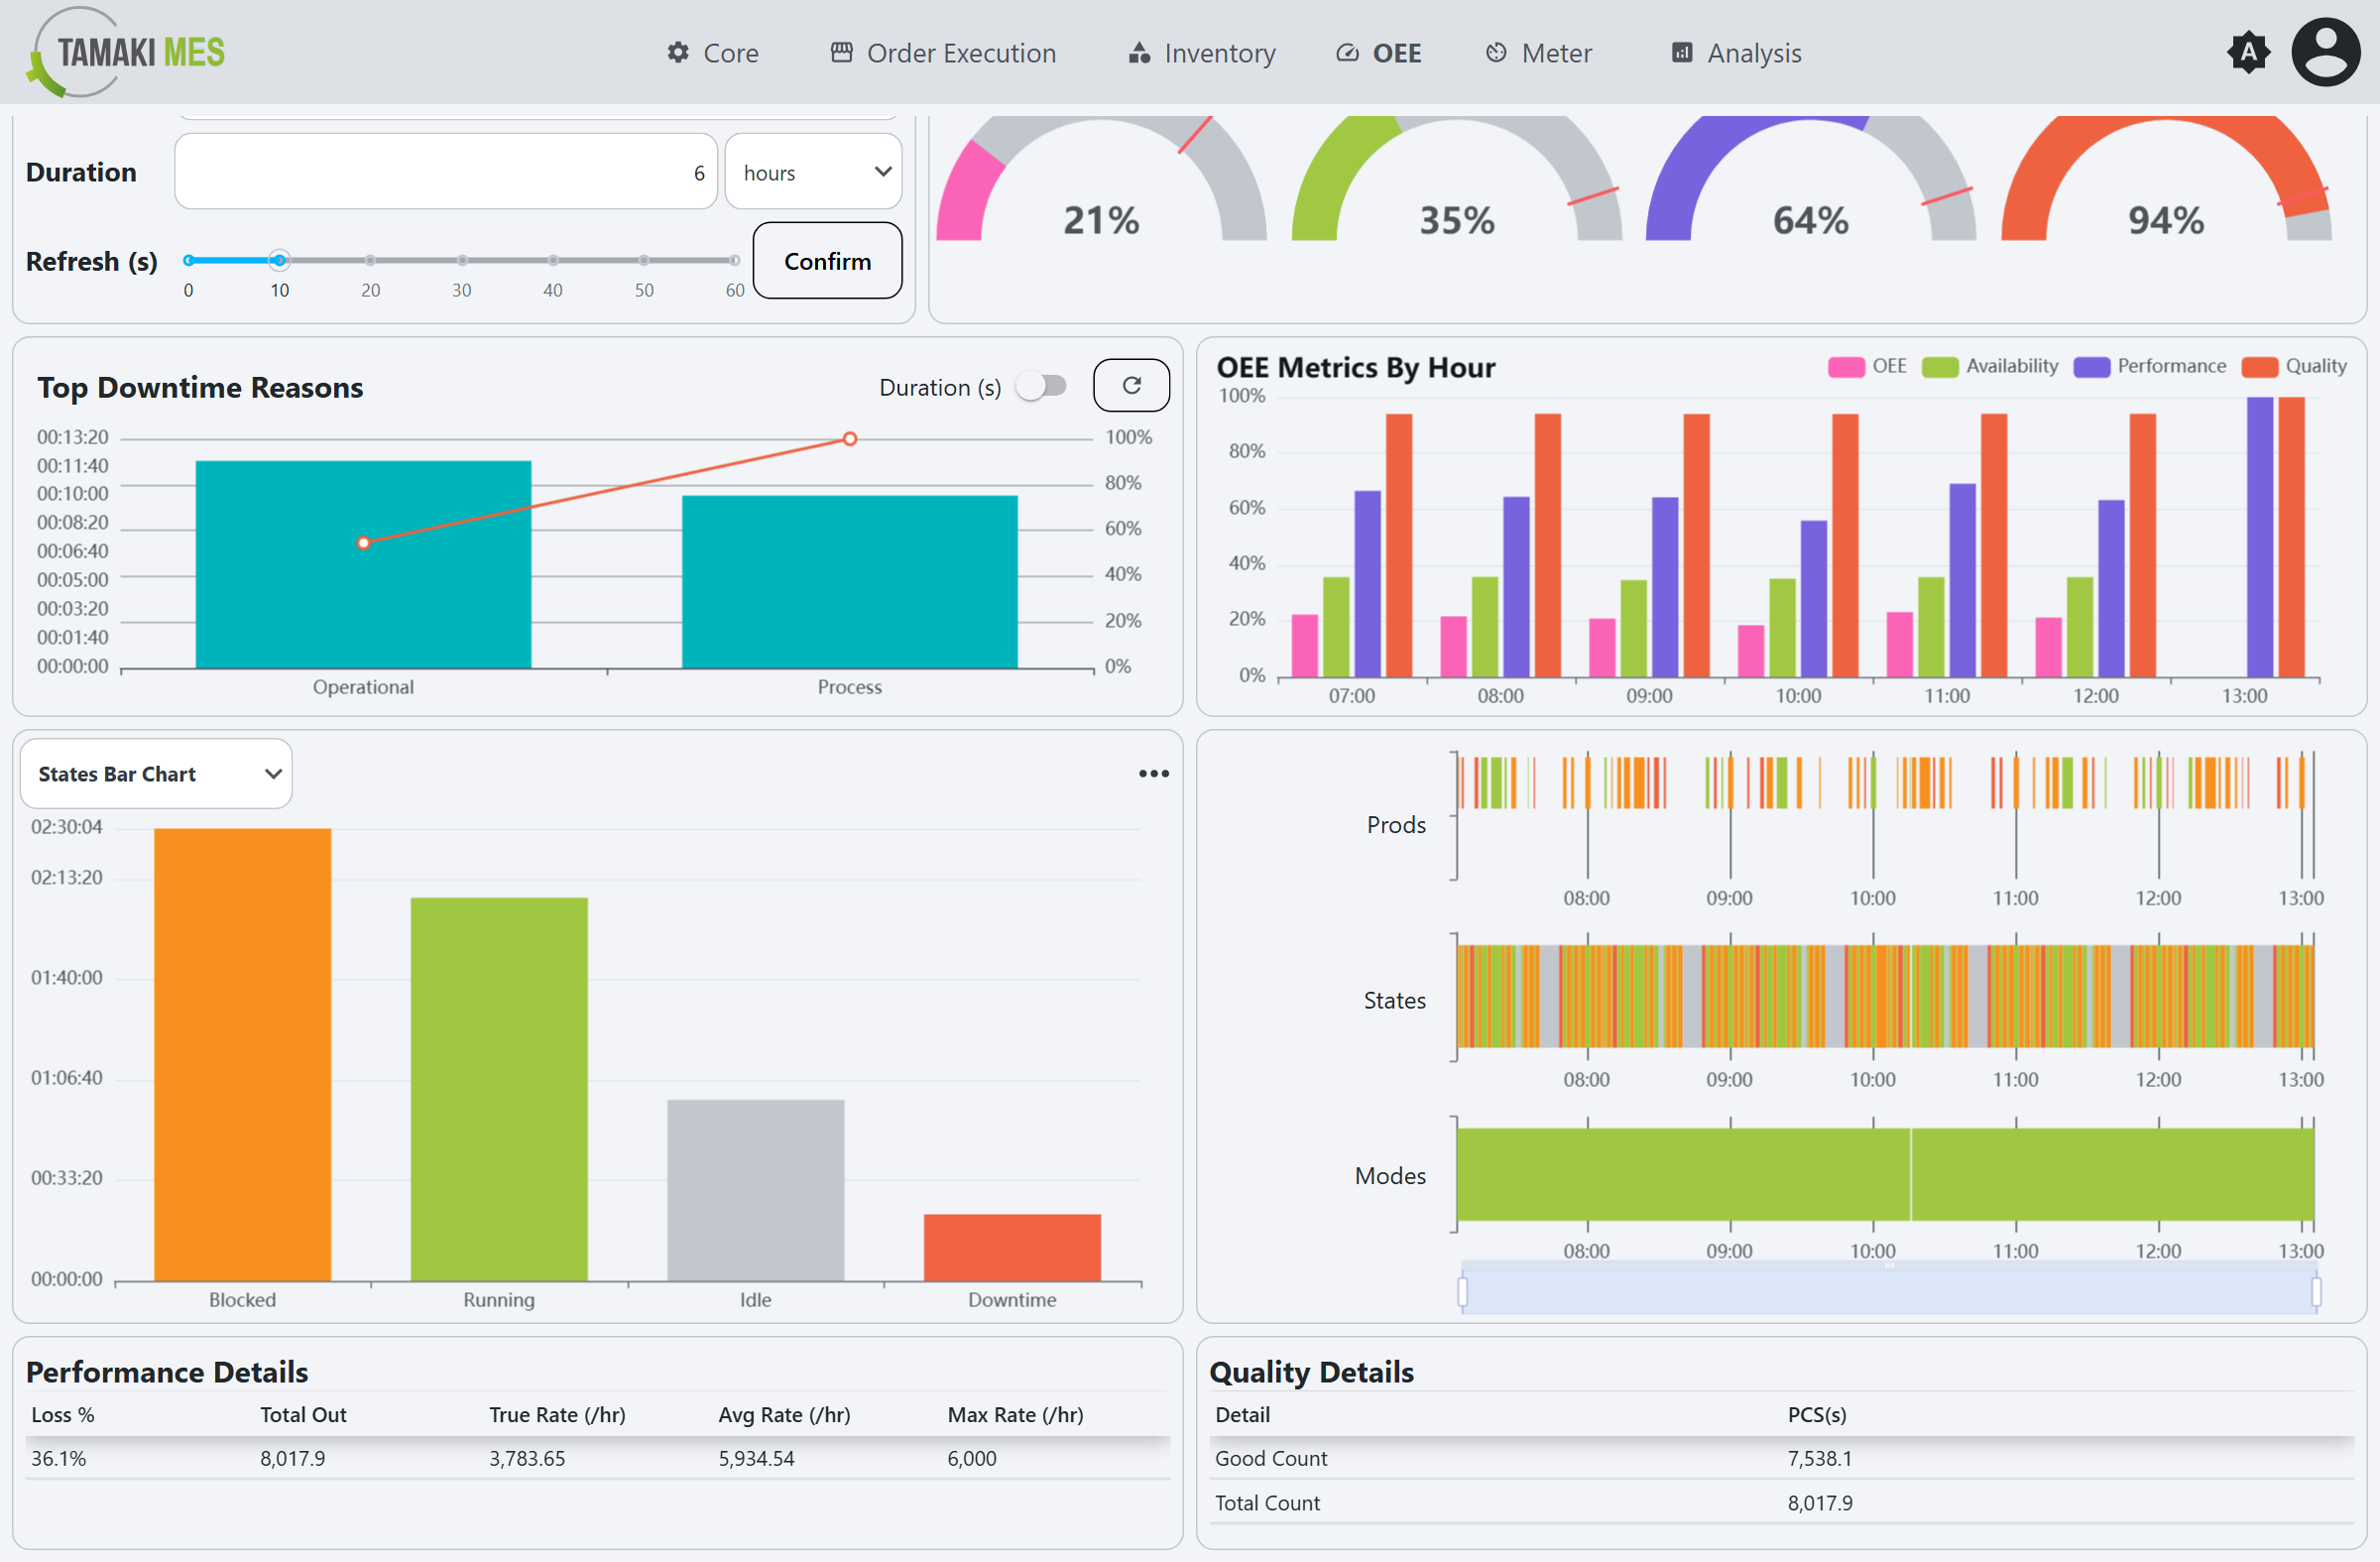
- Performance Details: Loss %, Total Out, True Rate, Average Rate, and Maximum Rate (per hour), measuring how the unit's output compares to its Standard Rate.
- Quality Details: Good Count and Total Count, in the unit's production unit of measure.